We’re always in search of the “ultimate” macro catalyst.
Analysts spend endless hours parsing Federal Reserve meeting transcripts, tracking credit spreads, and charting the path of the 10-year Treasury note to guess the next major move for the S&P 500 Index ($SPX). Heck I do most of those things on a regular basis!
But in the near term, the real driver of the stock market’s immediate destiny might not be hidden in a central bank spreadsheet. It might be decided on a hardwood basketball court.
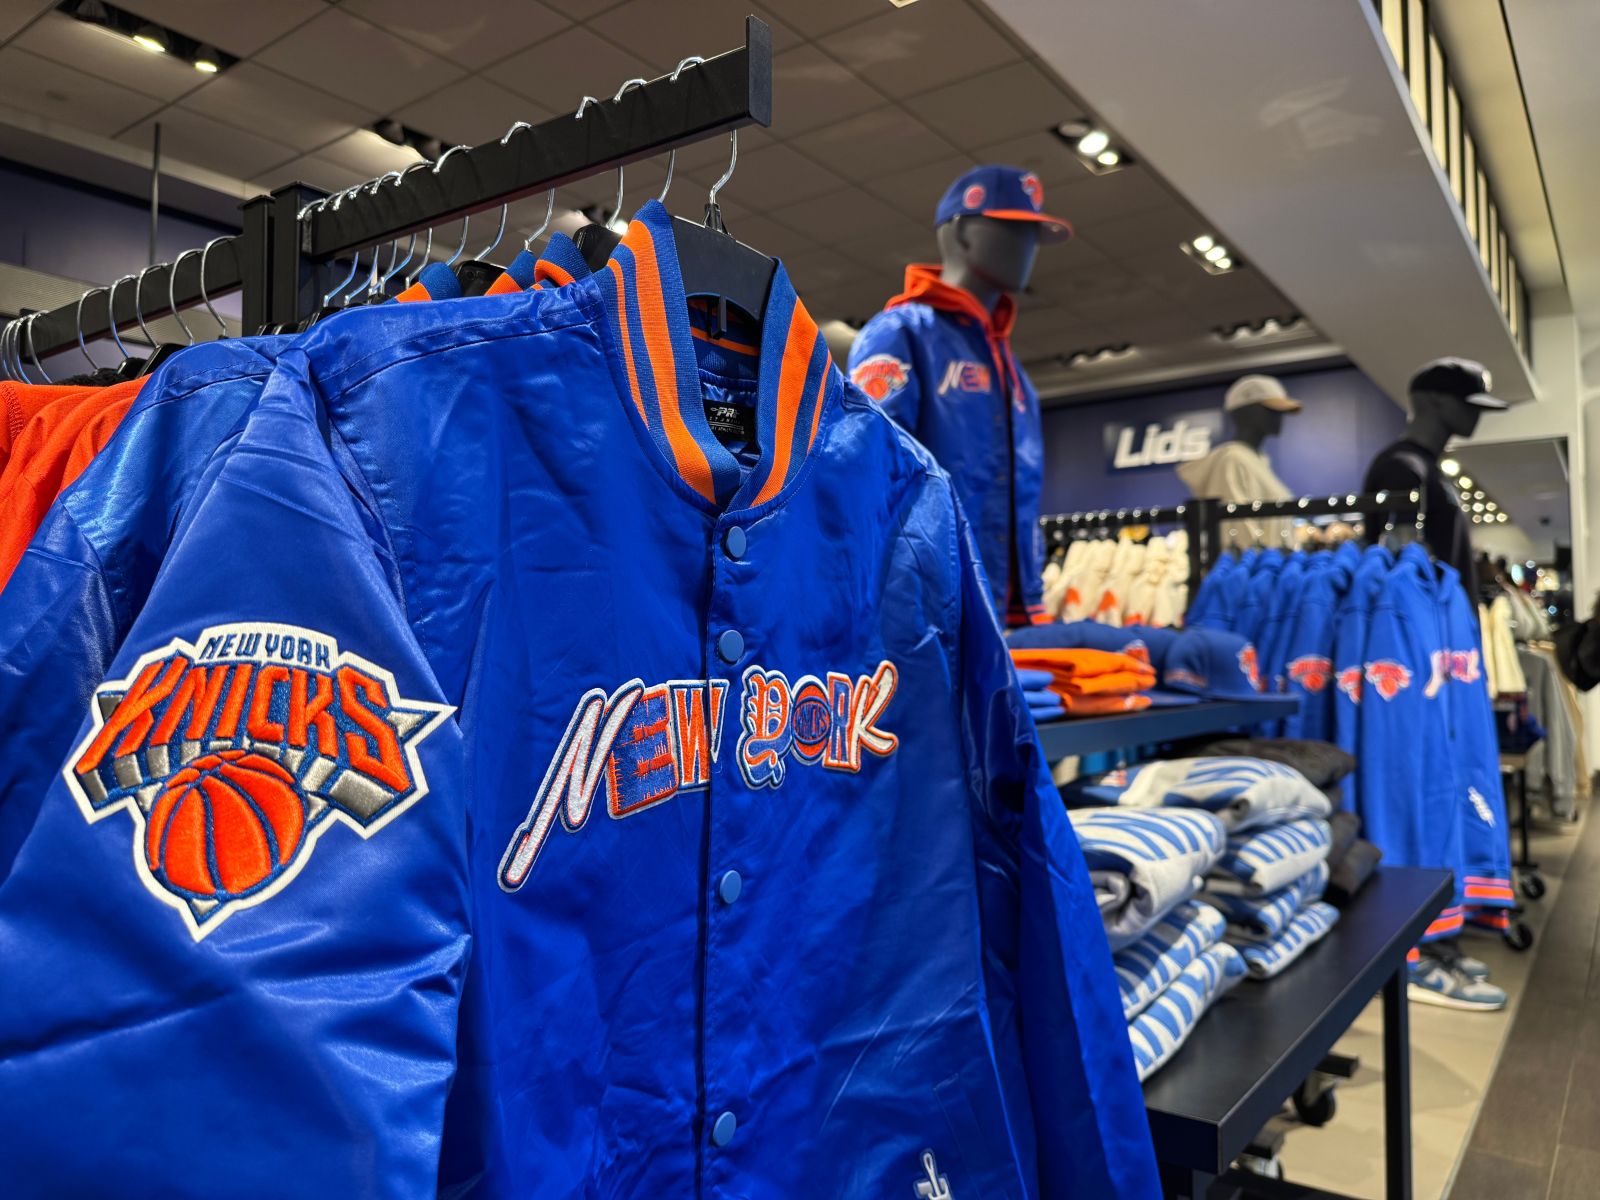
The sports world is locked into a compelling NBA Finals matchup: the New York Knicks vs. the San Antonio Spurs. The Spurs were not even an NBA team the last time the Knicks won it all. They were playing in the American Basketball Association, which merged with the bigger league in 1976. That was three years after the Knicks defeated the Los Angeles Lakers (led by Wilt Chamberlain) to win their second title in a four-season time frame.
I’ll admit, this is personal to me. I am not a big NBA fan, but when the Knicks were last on top of the world, I was a nine-year-old kid in suburban New Jersey, trying to sleep upstairs when downstairs, my father and his best friend were watching the Knicks game. And screaming, and pounding the carpet with their hands.
As I’ve noted here before, my late father was my first investing mentor, teaching me to chart when I was 16 years old. If you’re keeping score at home, that was seven years after he repeatedly woke me on school nights during Knicks playoff games.
If you look at this matchup through the lens of history, there is an eerie, ominous parallel that should make every equity investor’s blood run cold. Because the last time the New York Knicks actually won an NBA championship was 1973. Does that year ring a bell, my fellow market historians?
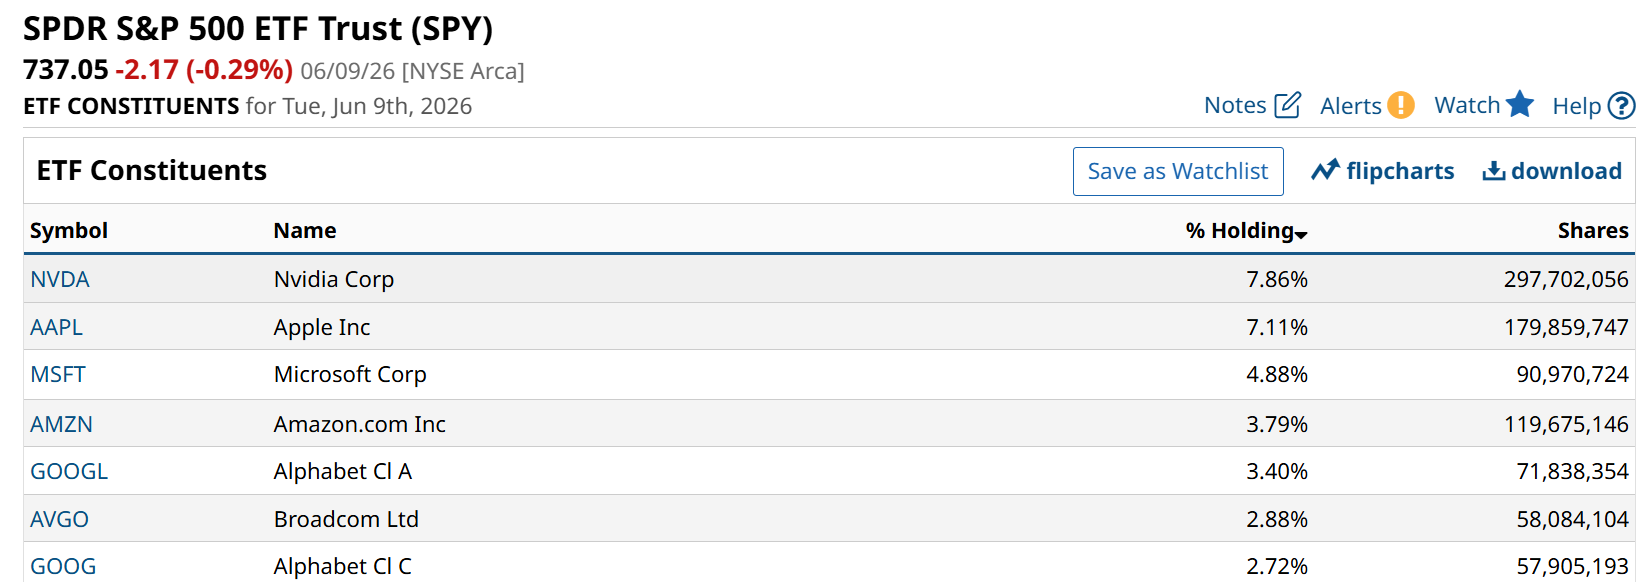
It should. Because that was the last time the stock market was this obsessed with and ruled by a small number of stocks. Back then, they were called the “Nifty Fifty,” and included companies like Polaroid, Xerox, and Avon. Think about that the next time you are certain today’s Magnificent 7 will endure forever.
At the time, a small number of stocks made up nearly half the U.S. stock market index by size. Very similar to today.
How did Wall Street celebrate the triumph of that Knicks team, led by Walt Frazier and Willis Reed? Right around that time, the Nifty Fifty bubble officially burst. Inflation became stubbornly sticky, interest rates spiked, and the over-concentrated point spread of the broad market collapsed into a devastating 40% indexing bear market that took a decade to recover from. The glamorous top-heavy narrative was completely dismantled by economic gravity.
And because this is Barchart.com, where we have a financial data set that rivals anyone’s, here’s how that 1973 picture played out, for stocks ($DOWI).
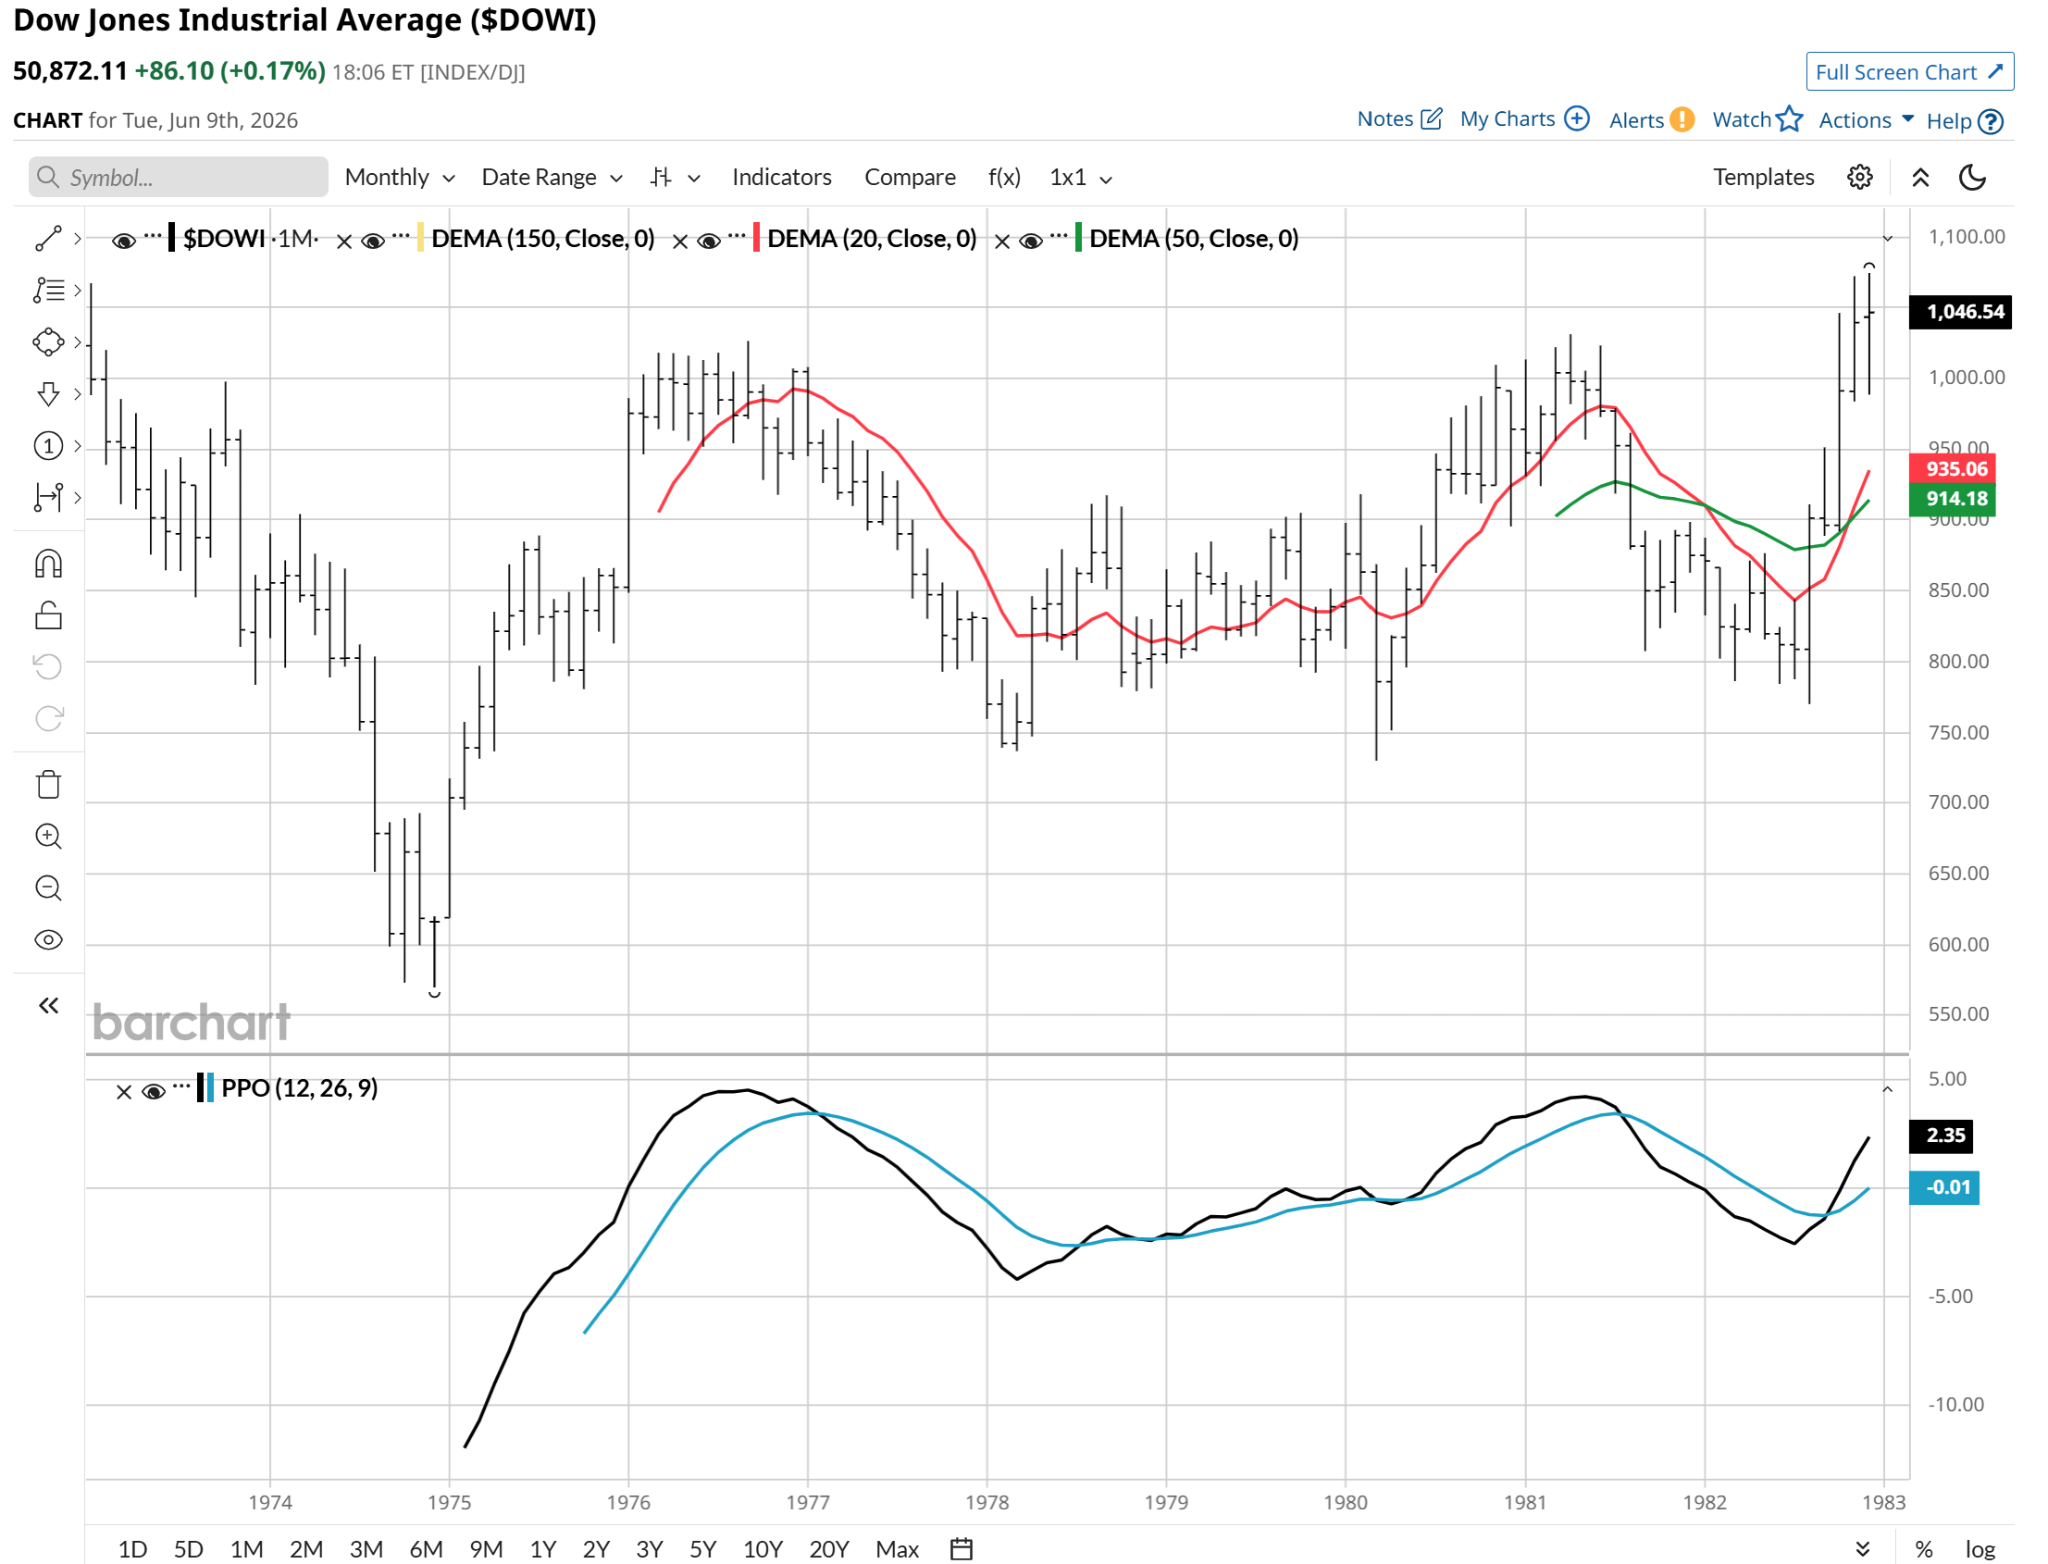
That’s a lost decade right there. Because the issue many investors ignore when considering risk management is that the eventual dip you buy, with the rest of your portfolio down, say 50% as in this case, that’s only plugging the leak in the boat. You then need to return 100% just to get back to where you started. If that takes 10 years as shown here, that’s a decade of zero return, lost opportunity and inflation impacting the value of that very portfolio of stocks. Keep that cyclical math in mind in these cautious times for investors.
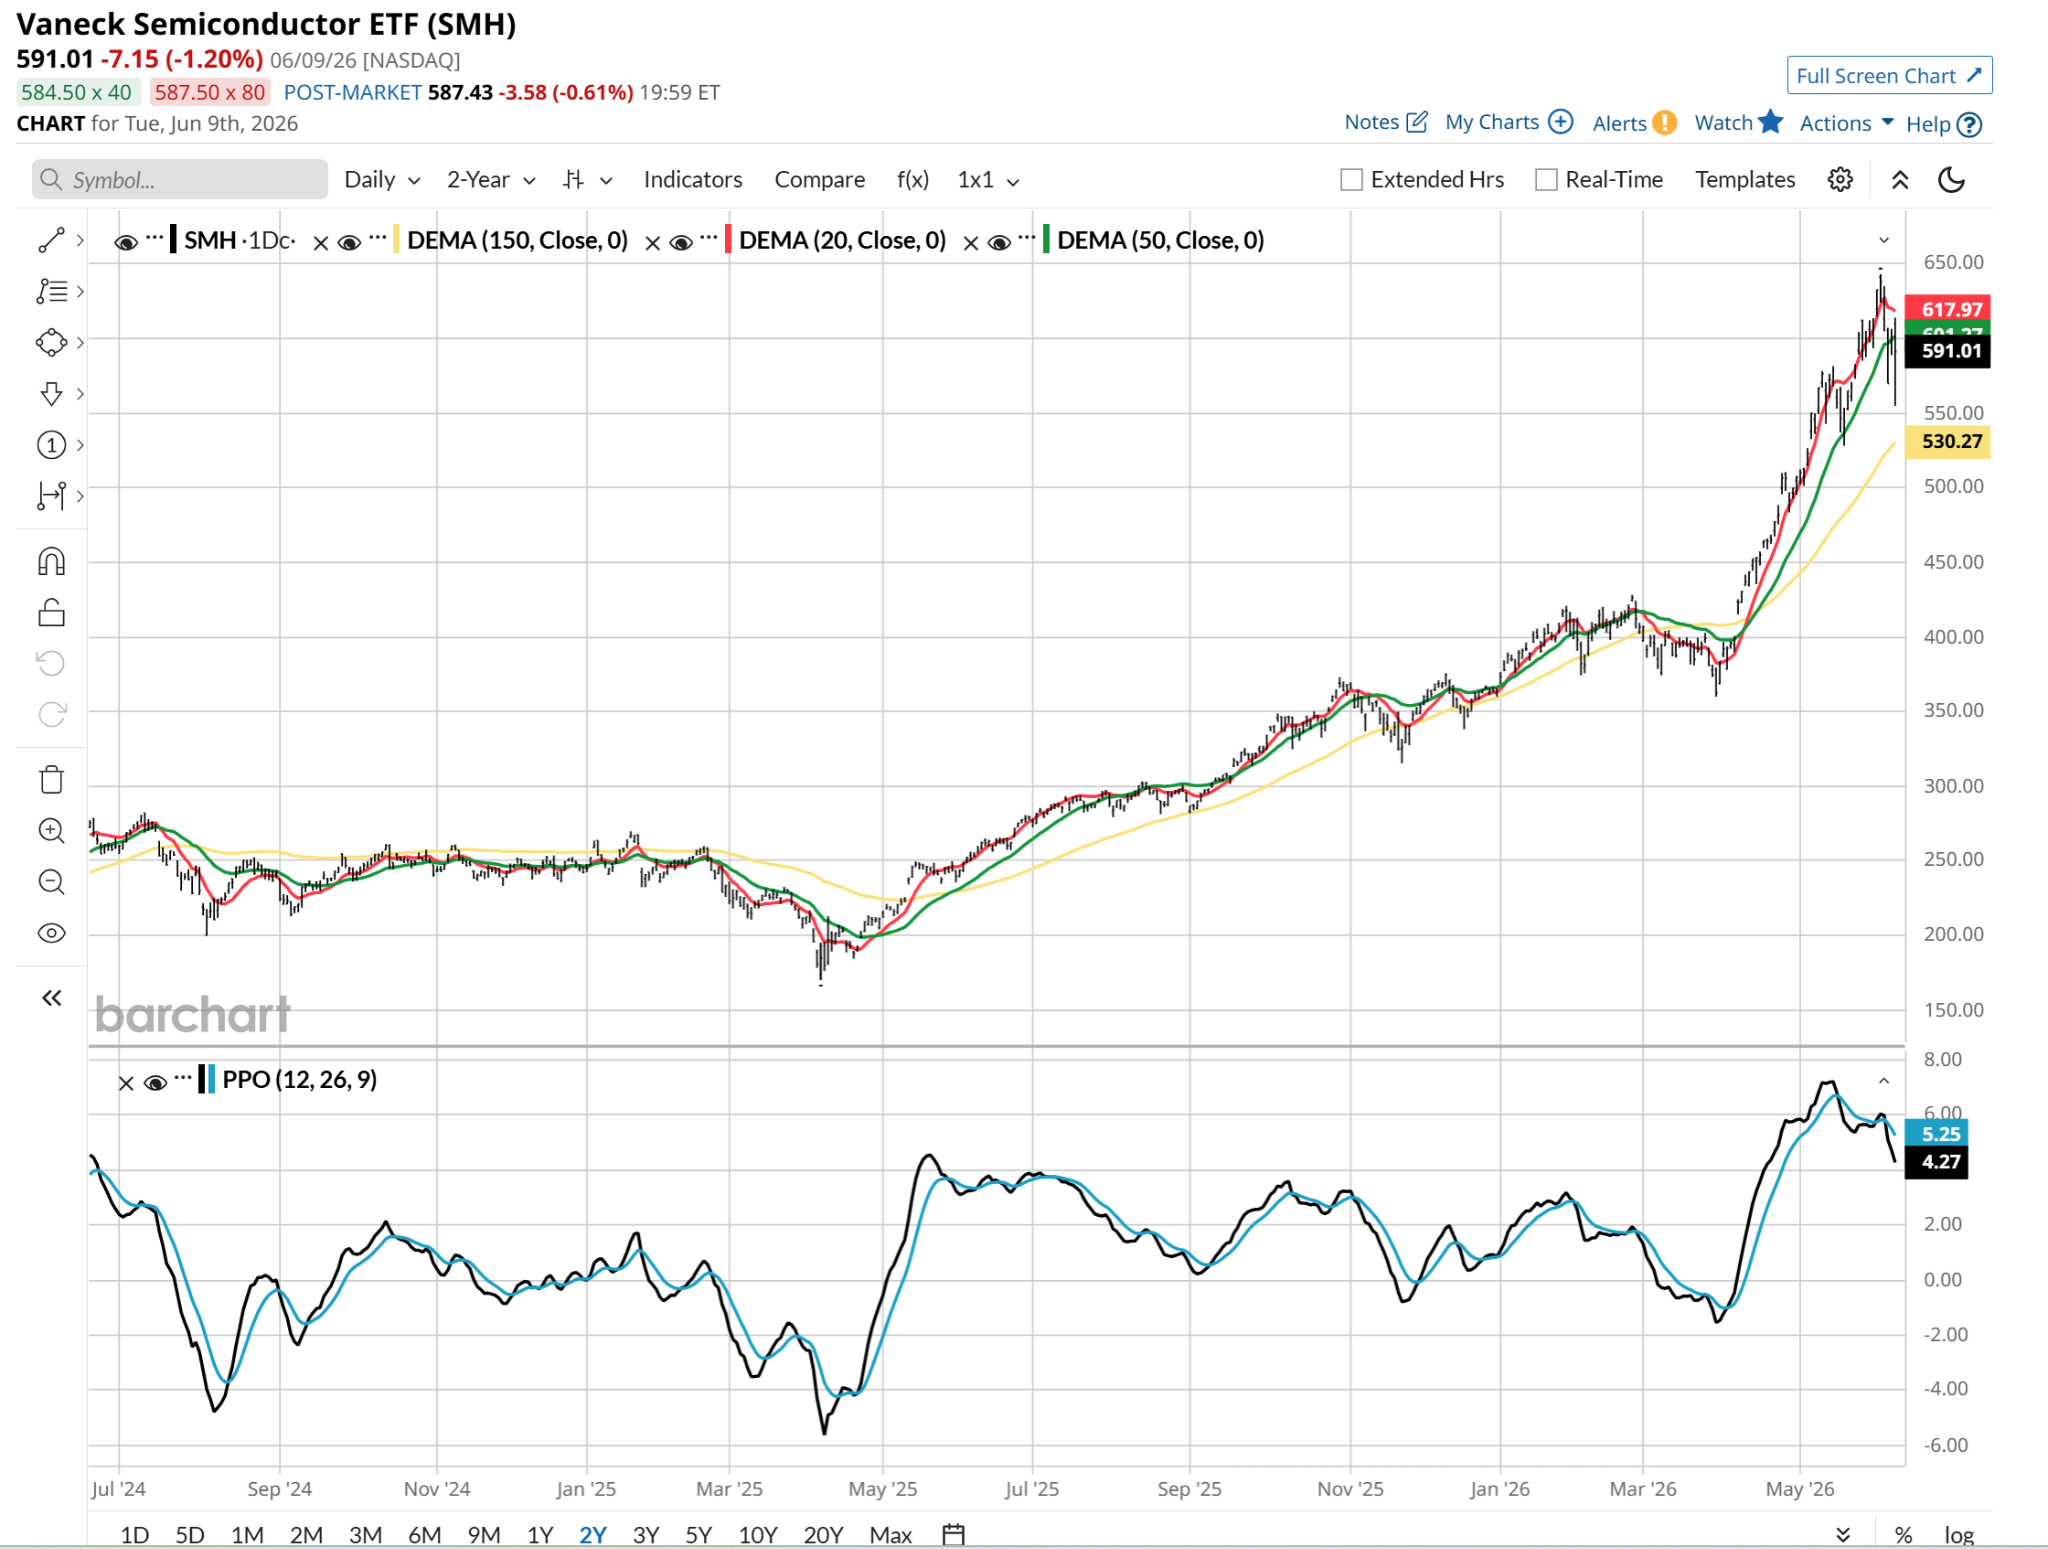
Just like buying into a heavy sports favorite at a massive premium, the headline index now requires absolute, flawless execution. The corporate heavyweights holding up the S&P 500 have zero margin for error. If the semiconductor cycle catches even a minor cold, or if inflation keeps input costs sticky, the passive index funds face a violent, mechanical unwind. As shown above, one of the major chip ETFs, the VanEck Semiconductor ETF (SMH), has the look of a very vulnerable, overvalued index to me. That PPO is best described as “ominous.”
Of course, the outcome of a sporting event can’t be directly attributed to the follow-on behavior of the stock market. But if this quick trip back into pro basketball history helps fill in some of your understanding of past market outcomes in an era of crowded stock indexes and rising inflation, I’ve done something useful. And my Dad can add another proverbial trophy to his case.
Rob Isbitts created the ROAR Score, based on his 40+ years of technical analysis experience. ROAR helps DIY investors manage risk and create their own portfolios. For Rob’s written research, check out ETFYourself.com.