A popular stat for fantasy baseball managers over the last decade is BABIP (Batting Average Balls in Play). However, this data point isn’t a good reference for determining a player’s batting average. Every player in baseball has their own skill set and baseline for BABIP. Like batting average, this stat can have a wide range from season to season for each player. What looks suitable for one player in one season may be bad for another player in the same year.
The bottom line for me is that if a player hits the ball hard, he will get more hits. With poor contact, a hitter will make easier outs.
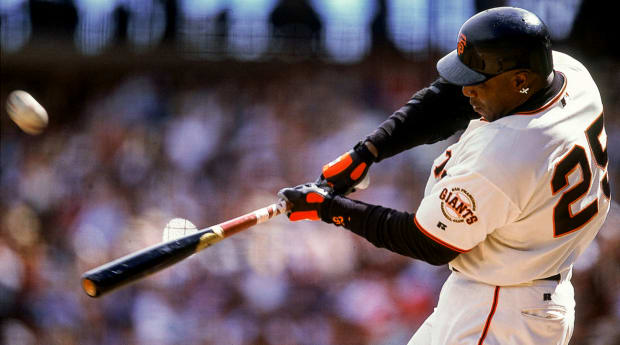
My best example of this is Barry Bonds. He has a career .285 BABIP while hitting .298 in his major-league career. In essence, his low BABIP was due to a high volume of home runs (762), which is the part that bothers me the most. Why are we discounting the hardest hit balls? If a player hits a line drive off the centerfield wall for a hit, the defense had no chance to catch the ball. The same goes for a ball over the fence. Therefore, I decided to go against the grain in this area. I came up with CTBA (contact batting average). I wanted to know what a player hits when he makes contact with the ball.

V.J. Lovero/Sports Illustrated
CTBA = Hits divided by at-bats minus strikeouts. (Looking back, I probably should add back at-bats resulting in sacrifice flies.)
Bonds had a career contact batting average of .353 (.350 with San Francisco). From 2001-04, he hit .328, .370, .341 and .362 with a contact batting average of .408. Over this span, Bonds had 775 walks and 438 strikeouts over 1,642 at-bats. His BABIP was .303 during this stretch.
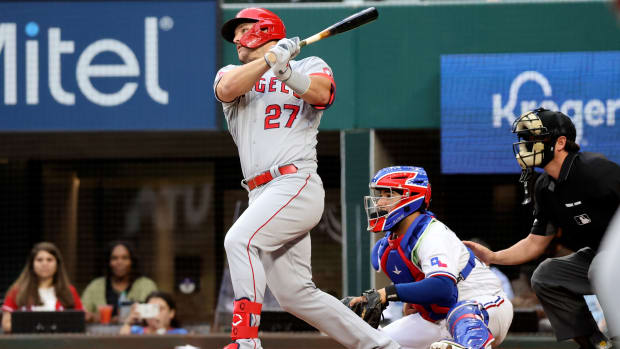
When looking at Mike Trout's career, you can see a high BABIP in some seasons (.383, .372, .349, .344, .371, .318, .346, .298, and .300). He’s had an elite CTBA every year:
2012: .433
2013: .419
2014: .414
2015: .412
2016: .420
2017: .394
2018: .424
2019: .391
2020: .392)
(I left out 2021 since he only played in 36 games)

Trout's CTBA shows his explosiveness in batting average each year, while his BABIP had a much wider range of value, bottoming out in 2019 (.298). Ultimately, Trout has batting title upside based on his CTBA if his strikeout rate shrinks. He has a strength in his BABIP (.348) and CTBA (.412) in his career.
For comparison, Ichiro Suzuki hit .311 in his career with a BABIP of .338. His CTBA finished at .349, almost matching Bonds (.353).
My goal with CTBA is to determine a better range for batting average. Most of us fear high strikeout batters as they can kill us in batting average, but players with an elite contact batting average can overcome some of their downside while also having a chance to lower their strikeout rate.
The major-league average for CTBA in 2021 was .330 (.332 in 2020), which makes sense. It tells us that about one out of every three balls put in play was a hit.
In my early development as a fantasy baseball manager, I used Ron Shandler’s Baseball Forecaster to do my research. He had a stat called contact rate (at-bats minus strikeouts/at-bats). When using this data, it helped to avoid high strikeout batters that invited batting average risk. But, at the same time, it did cause me some confusion as to what type of hitter had the most upside in batting average.
Other examples
By looking at Miguel Sano's major-league profile, he has a .238 batting average in his career with the Twins with an insanely high strikeout rate (36.5%). Unfortunately for Sano, his contact rate is only 63.5%, which screams disaster downside in batting average.
On the flipside, his contact batting average in the majors is an impressive .404, with a high of .446 in 2017. If Sano lowered his strikeout rate to 30% while maintaining his career contact batting average, he would become a .274 hitter.
Jose Ramirez worked his way into being a top-five fantasy player this draft season. In 2016-17, he hit .315 over 1,150 at-bats with a BABIP of .326. For someone relying on BABIP to evaluate batting average with Ramirez over the next four seasons (.252, .256, .294, .256), they may conclude that he was unlucky in some of these years with the hopes of him becoming a .300 hitter again.
The truth is Ramirez had a change in his swing path in 2018 that carried over in his following seasons. He became a fly-ball hitter (over 45%), leading to 115 home runs over his last 1,831 at-bats. His contact batting average over that span was .317, which was his ceiling for batting average if he never made an out. In 2016-17, Ramirez hit .355 when putting the ball in play. His regression in batting average came from making easier outs via fly balls, as his strikeout rate (12.2) has been low for his whole career.
Over his first three seasons with the Padres, Fernando Tatis Jr. has an impressive contact batting average (.426). His strikeout rate (27.6) remains well above the league average, but he has had success in batting average each year (.317, .277, .282). In his rookie season, Tatis finished with an exceptional BABIP (.410 – .473 contact batting average). Over the previous two years, his BABIP slipped to .306 and .324. His regression in 2020 came from a lower strikeout rate (23.7) and last year from more balls leaving the park. Tatis hit .380 and .415 when putting the ball in play over the past two seasons.
With more experience, Tatis should naturally have growth in his approach with fewer strikeouts and push his batting average to an elite level. In addition, about 30% of his fly balls leave the park, creating a home run beast.
As a fantasy manager, I want the players who have the best chance to hit the ball hard, leading to home runs and production in RBIs. We must walk a fine line deciding between high strikeout batters to limit the damage in batting average. Contact batting average is a way to see who has the best chance to get a hit when they put the ball in play, which isn’t the case for BABIP. A high CTBA and improving approach signals a potential breakout player.


