Shares of Chevron (CVX) were down about 4% at last check after the oil major reported earnings, but they're still up slightly over the past two days.
Chevron stock rallied almost 5% on Thursday and closed right near the session high. The company reported earnings this morning.
Thursday’s rally reflected the company announcement of a $75 billion buyback plan — keep in mind that Chevron has a market cap of roughly $350 billion. The company also raised its dividend 6% and now pays a forward yield of roughly 3.4%.
On Friday morning, Chevron reported earnings of $4.09 a share, up 60% year over year but missing expectations of $4.38 a share. Revenue topped expectations.
Despite the earnings miss, Chevron clearly is humming along. While estimates call for a dip in earnings and revenue in fiscal 2023, we’re still talking about a stock with a low valuation and a decent yield — not to mention a massive buyback on the way.
What do the charts tell us?
Trading Chevron Stock on Earnings

Chart courtesy of TrendSpider.com
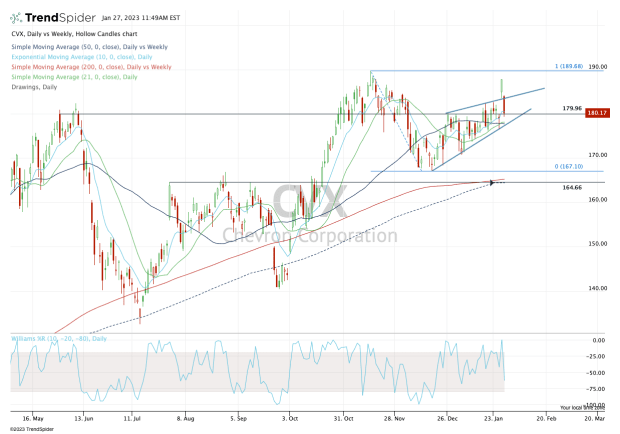
Chevron stock put together a massive rally off the fourth-quarter low. The shares climbed in six straight weeks on the way to an all-time high in November.
That led to a pullback down from about $190 into the $160s, where the shares consolidated with a series of higher lows — a bullish technical development — and beneath the $180 resistance area.
Chevron has been trying to break out over $180 this month, and Thursday’s action jump-started the move. It almost surely seemed to put new highs in play. But today’s pullback into the $180 area has traders thinking twice about that assumption.
For the bulls, it’s encouraging that the stock is pulling back into the 10-day, 21-day and 50-day moving averages, as well as recent uptrend support. So long as this week’s low at $176.35 holds, Chevron looks okay.
If this level gives out and Chevron stock can’t regain it, we could be looking at a deeper decline on the horizon.
I’m not sure if we’d get a dip back down into the mid-$160s, but in that zone, it would find recent support and a prior breakout level, as well as the 200-day and 50-week moving averages. That zone would likely draw in buyers.
On the upside, look for a move back over $184.25. That would open the door to $188, then the highs near $190 and eventually $200.


