
Solar stocks in 2022 have been on fire, with many in the group acting as market leaders.
It’s been a very difficult year broadly, but as far as sector performance goes, the clear bullish outlier has been energy, as many of these firms continue to hit new highs.
One part of energy that investors often overlook is renewable energy -- and that would be a mistake as many of these stocks continue to trade quite well.
Trading First Solar Stock
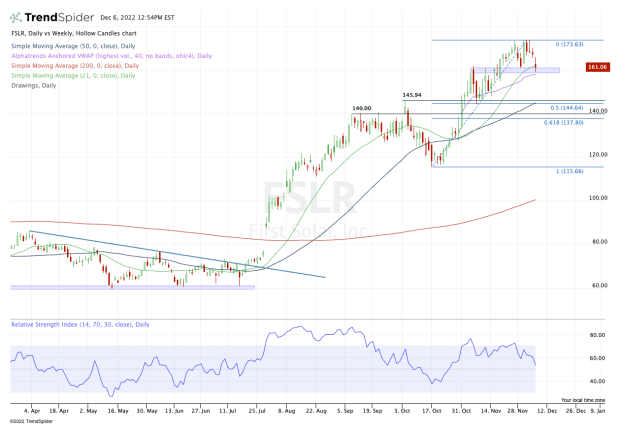
Chart courtesy of TrendSpider.com
First Solar (FSLR) is likely the first stock that comes to mind when investors hear the words “solar stocks.”
But when we look at the Invesco Solar ETF (TAN), it’s actually the No. 2 holding with a 10.4% weighting. It trails the 11% stake in Enphase Energy (ENPH) (the next stock on this list).
First Solar stock is up 84% so far in 2022 and is currently pulling back into active support.
Aggressive bulls can look for support in the $160 area, as it tests its 21-day moving average for the first time since October and the daily VWAP measure in almost a month.
Further, the $160 area was resistance in October and November, but support earlier this month.
If this zone holds as support, first look for a bounce back to the $165 to $168 area, then $172.50-plus is possible.
On the downside, a break of all these support levels could open the door down to the $145 area. I’m not sure whether First Solar stock will get there, but if it does soon, it’s where we find a prior support/resistance zone, the 50% retracement zone and the rising 50-day moving average.
Trading Enphase Energy Stock
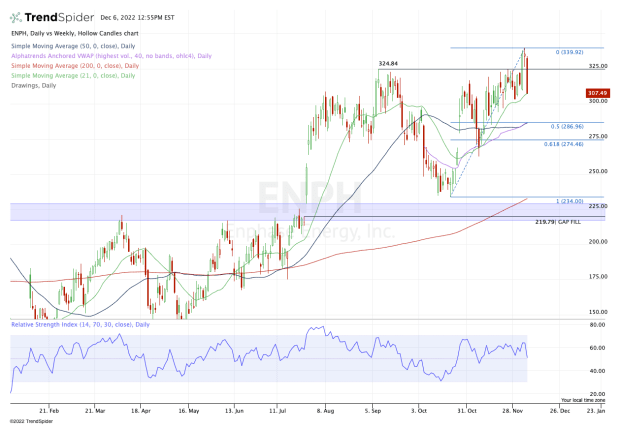
Chart courtesy of TrendSpider.com
Enphase Energy stock has been trading quite well — hitting all-time highs yesterday — but is trading rather poorly today, down more than 8%.
At the same time the stock is trading down into active support via the 21-day moving average. Aggressive bulls can look for support from this level. If it holds, it could put $320 to $325 back in play, followed by $340.
If the 21-day moving average fails as support and Enphase Energy stock drops below $300, it could open the door down to the $285 area, where it finds the 50% retracement, the daily VWAP measure and the 50-day moving average.
Trading Constellation Energy Stock
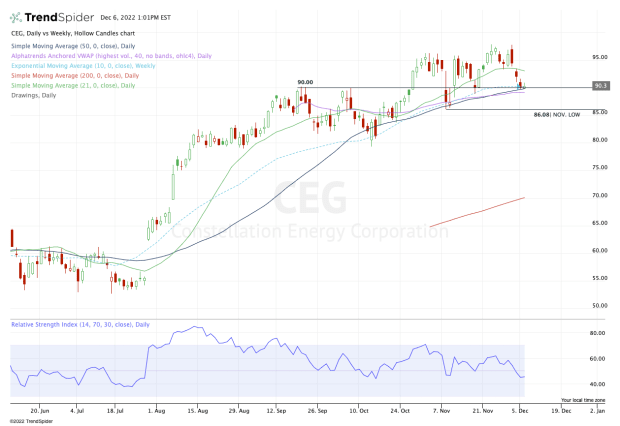
Chart courtesy of TrendSpider.com
Constellation Energy (CEG) should be on investors' screens. This renewable-energy name continues to trade quite well and has more than doubled (up 136%) from where it opened on Jan. 19, when it began trading for the first time this year.
With today’s action, the stock is trying to find its footing around $90. Not only has this level been a key support/resistance pivot area, but it’s also where the daily VWAP comes into play, along with the 10-week and 50-week moving averages.
All these measures should provide the stock with some decent support.
If not, keep an eye on the November low near $86. A break of this level does not signal a bullish development and could open the door down to the $78 to $80 area.
If it does hold, look for a potential bounce back to the $92.50 to $95 zone. Above that puts $97 in play, followed by $100.