The +4.9% reading for Q3 GDP Thursday morning was a bit of a surprise...but does show that the GDPNow model from the Atlanta Fed was amazingly on target.
Oddly this would seem to show that the US economy may be overheating which would apply some additional inflation pressure. Amazingly, the opposite is true.
The Fed’s favorite measure of inflation, Core PCE, actually came down from 3.7% to 2.4%...pretty darn close to their 2% target level.
This is great news, right?...so why did the S&P 500 (SPY) continue to tank on this news falling ever further below the 200 day moving average?
Moving Averages: 50 Day (yellow), 100 Day (orange), 200 Day (red)
Because bond rates remain elevated. Some investors are afraid about what that means for the softening of the future economy in the future as I discussed in this recent commentary about rate normalization.
Warning> Investors Prepare for “Sea Change”
The above is not necessarily a sign of bearish things to come...but it does speak to how rates getting back to normal levels after a loooooonnnngggg period of ultra low rates would likely equate to slower growth and stocks not being uber-bullish.
Above is the good version of the story. The much more ominous version of the story was shared in my commentary from earlier this week about the concept of “Debt Supercycle”. You can read that in the article below:
Bear Market Warning from the Bond Market?
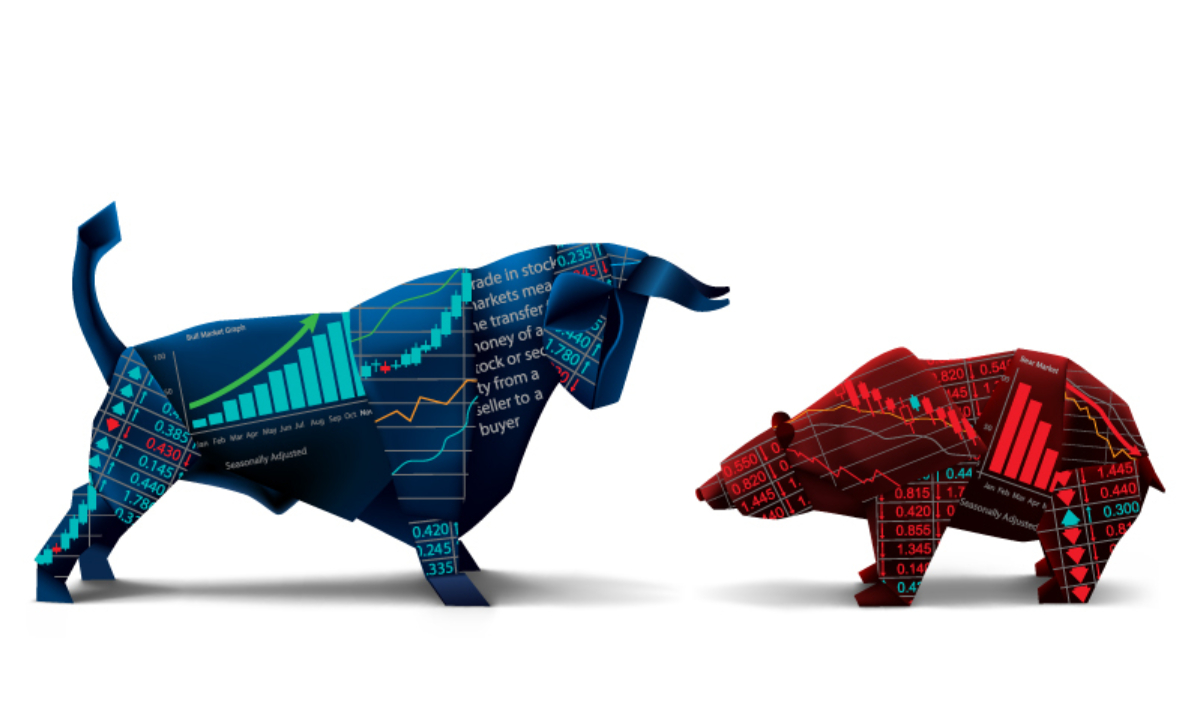
So now we ask ourselves...are we in a bull market or bear market now???
The definition of a bull market is when the S&P 500 rises 20% above its low. Well, the October low of 3,491 x 20% = 4.189. We were well above that for majority of the year...yet are a notch below that now. The point being from this classical point of view we are in a bull market.
Unfortunately we all know that the S&P 500 is no longer a good stock index because it is overly influenced by the 7 mega cap tech stocks that hold far too much sway. That is why people often like to look at broader measures of the market such as the Equal Weighted version of the S&P 500 (RSP).
There we realize the bottom was 124.92 and the 52 week high was 24.7% above at 155.77. That also passes the bull market test...but is faltering fast as we are currently 13.19% below that late July peak.
Now let’s consider the Russell 2000 filled with small caps that actually peaked in November 2021 at 2,421 and is now 31.56% below at 1,657. That most certainly does not sound bullish.
The grand point is that right now the bull/bear debate is in flux as high bond rates have, that may keep going higher, is calling the future health of the economy into question. This puts the stock market in limbo.
Not quite bullish...not quite bearish...but altogether uncertain. Unfortunately, when the market is uncertain it has a downward bias which is clearly on display of late.
This has compelled me to get more cautious in my approach in the Reitmeister Total Return service that has now been reduced to just 50% long the stock market after recent trades to sell some stocks...plus adding 2 inverse ETFs into the portfolio to rise in value if the overall market continues to decline.
If things keep getting more bearish in outlook, especially if the odds of future recession are on the rise, then I will keep on this defensive course to remove all stocks in the portfolio and just go net short with inverse ETFs.
The signal to get long again will be sounded by the 200 day moving average which has proven to be the best timing indicator over the years for the long term trajectory of the stock market.
Conversely, if the rise in rates ends, then likely stocks will bounce back to life. So a break back above the 200 day moving average would be the best signal to expect an extended bull run. That should compel everyone to move back towards a 100% invested portfolio focused on Risk On positions.
All in all, we are at a tipping point. So, what happens next will likely have long term consequences. Gladly we know what to do once Mr. Market shows his hand.
What To Do Next?
Discover my current portfolio of 5 stocks packed to the brim with the outperforming benefits found in our POWR Ratings model.
Plus I have added 5 ETFs that are all in sectors well positioned to outpace the market in the weeks and months ahead. (And yes have some inverse ETFs in the mix that are rising as the market falls).
This is all based on my 43 years of investing experience seeing bull markets...bear markets...and everything between.
If you are curious to learn more, and want to see these 10 hand selected trades, and all the market commentary and trades to come....then please click the link below to get started now.
Steve Reitmeister’s Trading Plan & Top Picks >
Wishing you a world of investment success!

Steve Reitmeister…but everyone calls me Reity (pronounced “Righty”)
CEO, StockNews.com and Editor, Reitmeister Total
SPY shares were trading at $413.60 per share on Friday morning, up $1.05 (+0.25%). Year-to-date, SPY has gained 9.35%, versus a % rise in the benchmark S&P 500 index during the same period.
About the Author: Steve Reitmeister

Steve is better known to the StockNews audience as “Reity”. Not only is he the CEO of the firm, but he also shares his 40 years of investment experience in the Reitmeister Total Return portfolio. Learn more about Reity’s background, along with links to his most recent articles and stock picks.
Bull or Bear Market??? StockNews.com


