Now available at reduced prices: the new and improved Scott Boras “pillow contract”—extra firm version for 2024.
The agent invented the term in 2010 when Adrián Beltré accepted a one-year contract with the Boston Red Sox after a down year with the Seattle Mariners.
“When you wake up in the morning, it’s soft, it’s there, but it’s not there with you all the time,” Boras explained then. “That’s a one-year contract. It’s a pillow. You use it for a little bit, and you go on.”
Beltré also did get a player option year, but at such a low number it basically was there for “a calamity scenario,” Boras said.
This year Boras added some heft to pillow contracts for Cody Bellinger and Matt Chapman after neither received the kind of long-term offers the agent sought. The industry didn’t fully believe in Bellinger’s one bounceback season after he spent three years hitting .209. Chapman showed major red flags last season when he struggled against high fastballs (.172) and spin (.188), which is pretty much what MLB pitching is these days.
Both signed three-year deals with—here’s the pillow update—opt outs after the first and second years. Both signed with teams you figured were frontrunners all along; the Chicago Cubs with Bellinger and the San Francisco Giants with Chapman were rewarded for their patience.
What about the rest of The Boras 5: Blake Snell, Jordan Montgomery and J.D. Martinez, the last of his unsigned free agents? Martinez, at 36 with little defensive value, was looking at a one-year deal anyway. Montgomery, with a slightly below-average strikeout rate (21.4%), may be looking at one of those extra-firm pillow deals because evaluators are so enamored with swing—and—miss stuff.

Ron Chenoy/USA TODAY Sports
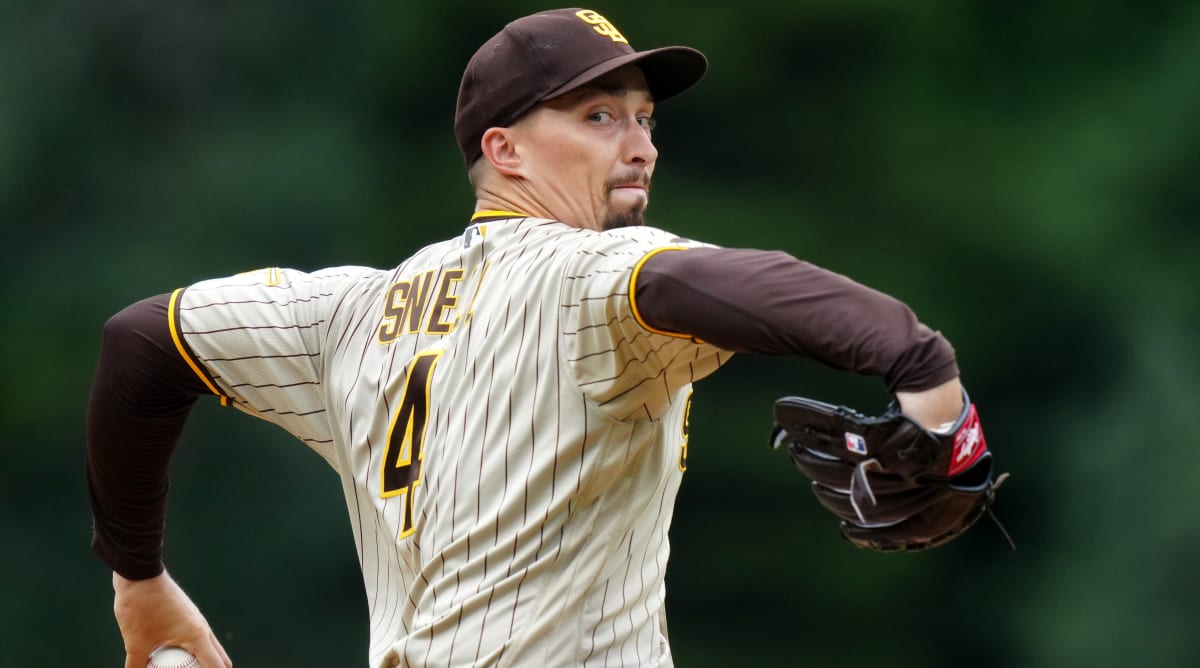
Snell is the one that baffles me about why no club has yet hit what Boras believes is his value. If Carlos Rodón is worth $27 million times six, Snell is about $30 million times seven. Rodón had never thrown 180 innings, had Tommy John surgery and a 115 ERA+ over 847 innings. Snell has thrown 180 innings twice, has had no procedure on his arm greater than removal of loose bodies in his elbow in 2019 and has a 127 ERA+ over 992 innings.
You have heard the knocks on Snell: walks too many guys, doesn’t pitch deep into games and isn’t reliable. I get it. He’s not your cookie-cutter ace. But he is an ace—a modern-day ace who doesn’t have to take the ball into the eighth inning and who misses bats like very few starters on the planet.
When you check out Snell’s 2023 rankings, you find an ace who may not be a “workhorse” but dominates games like very few pitchers:
Blake Snell 2023 Rankings
IP per Start |
5.6 |
Tied-43rd |
Innings |
180 |
T-24th |
Quality Starts |
20 |
T-5th |
Avg. Game Score |
61.4 |
T-2nd |
Pitches per Start |
99 |
T-1st |
100+ Pitch Games |
18 |
T-1st |
Snell led the league in walks and ERA. That’s crazy. How can that be? His ability to spin the baseball is so extraordinary, walks don’t matter much. These numbers are sick:
Hitters vs. Blake Snell Breaking Pitches, 2023
| Hits | Avg. | |
|---|---|---|
Overall |
22 |
.093 |
Two Strikes |
13 |
.066 |
RISP |
4 |
.066 |
RISP Two Outs |
1 |
.032 |
RISP Two Strikes |
1 |
.019 |
RISP, Innings 4+ |
0 |
.000 |
He gave up a hit once every 47 breaking pitches overall, or less than one per start. He threw 272 breaking pitches with runners in scoring position and only four of them resulted in a hit. And with two outs and RISP? Almost impossible: one hit out of 128 breaking pitches.
As for the “not an ace” narrative, consider the loose definition of an ace to be somebody who pitches at an elite level with durability. Over the past seven seasons, Snell fits the definition of ace, as this company proves:
Lowest ERA, 2017-23 (Min. 150 GS)
1. Clayton Kershaw |
2.68 |
2. Justin Verlander |
2.69 |
3. Max Scherzer |
2.78 |
4. Gerrit Cole |
3.14 |
5. Blake Snell |
3.17 |
Is Snell not the very modern ace front offices have created? Clubs train starters to miss bats while facing 18 to 22 batters before calling on one hard-throwing specialty reliever after another. Teams don’t want pitchers to go deep into games because they equate workload with injury risk and because they believe strongly that a fresh reliever is better than a starter facing the same hitter a third time.
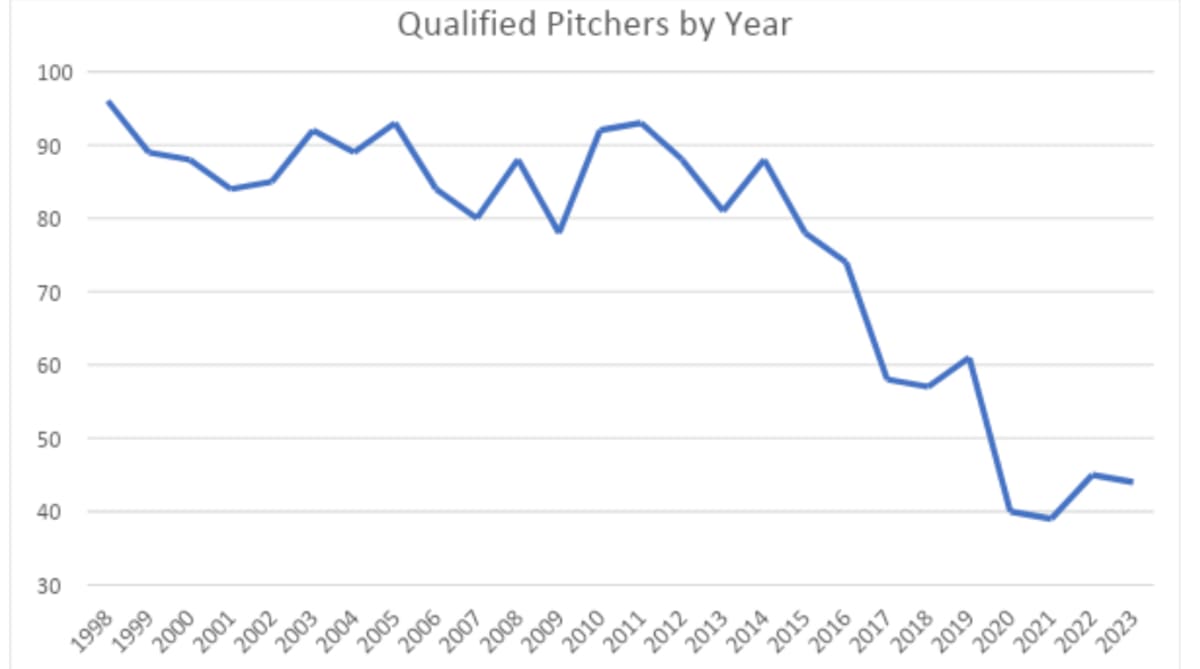
This is the game they built. The four seasons with the fewest qualified pitchers are the past four seasons. Starters pitch with more rest, throw fewer pitches and accumulate fewer innings than ever in baseball history. They have never been asked to do less:

The tipping point in the above chart is 2017, when qualified pitchers suddenly dropped 22%, from 74 to 58, likely never to return. Why then? More pitchers were getting hurt, especially blowing out their UCLs. And why was that happening? An increase in velocity and an increase in competitive year-round pitching on the amateur level leading up to 2017. This was the first generation of major leaguers who grew up as true showcase stars. Here is what the American Sports Medicine Institute said in 2016 about the epidemic of blown elbows:
“When an orthopaedist performs surgery on a torn ulnar collateral ligament (“Tommy John” ligament), the surgeon will almost always see a ligament that has frayed over time from overuse and repetition. In previous generations, Major League pitchers grew up competitively pitching only a few months each year, but nowadays leagues and teams are available for adolescents to play competitive baseball almost all year. Research has shown a strong link between too much competitive pitching and arm injuries.”
From 1998 through 2016, the average number of pitches in a start remained remarkably stable: between 93 and 97 pitches with a year-to-year variance never more than three. Then it suddenly plummeted: from 92 in 2017 to 88 in ’18 and to 86 in ’19. It was down to 85 last season.
Here is how much the landscape has changed in just 10 seasons:
| Year | QS% | IP/GS | P/GS | Qualified Pitchers |
|---|---|---|---|---|
2014 |
54% |
6.0 |
96 |
88 |
2023 |
35% |
5.1 |
85 |
44 |
Snell last season averaged 5.6 innings and 99 pitches per start, well better than MLB averages. Measured against the game today, not the game 10 years ago, never mind 50 years ago, Snell is an ace who dominates games for six innings. And yet, he remains unsigned.


