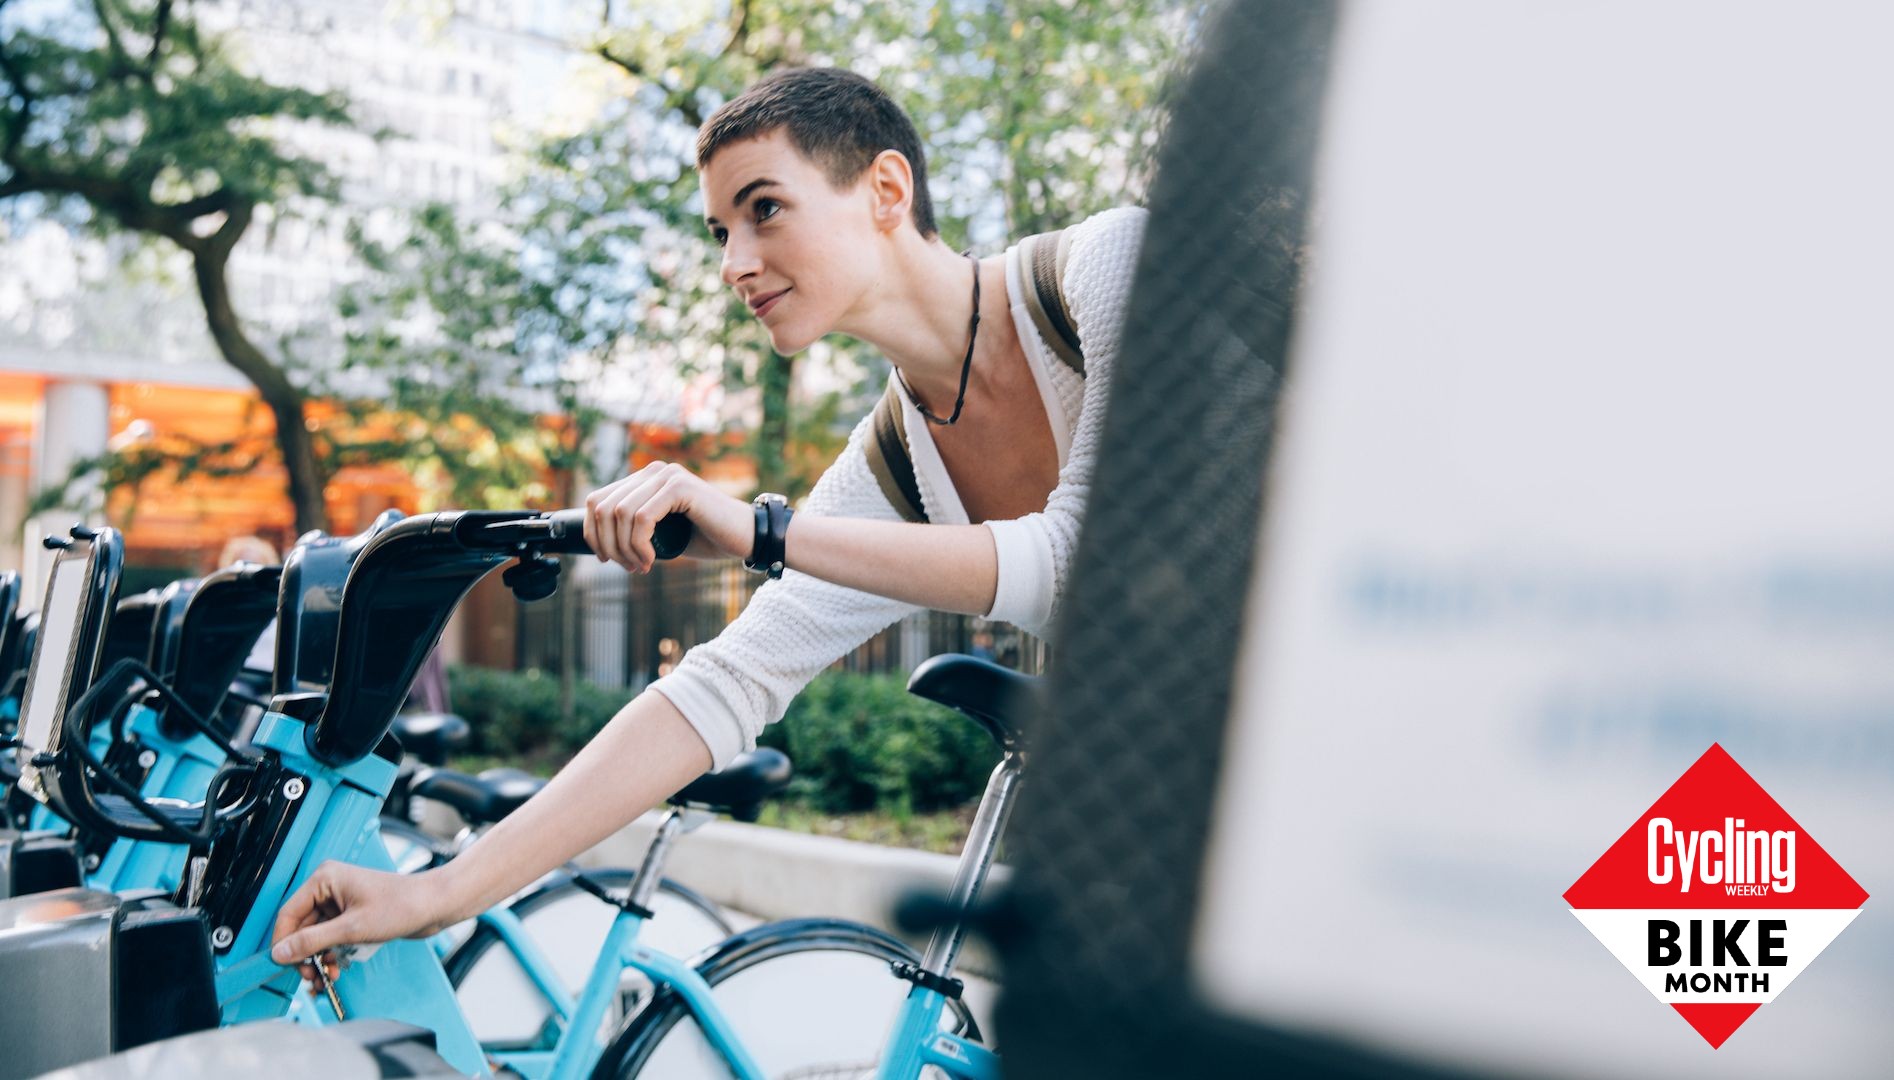
As people around the globe continue to grapple with inflation and a higher cost of living, many are looking at ways to save some money and cut down on everyday expenses. One of these cost-saving measures is leaving the car at home and using a bike to get around town. With bike share programs now available in most of America’ bigger cities, one doesn’t even have to own a bike.
Bike sharing is a shared transportation option where bicycles are readily available for individual use and generally, for short trips. There’s a reason these bike sharing programs are popular: there are fewer cars on the road, they cut down on greenhouse gas emissions and improve the public’s general health.
But is bike share cost-effective? If it isn't, what is? And at what price point would bike share actually make sense for daily commuters?
We looked at data from two of America’s biggest cities to find out.
Bike Share: How it works
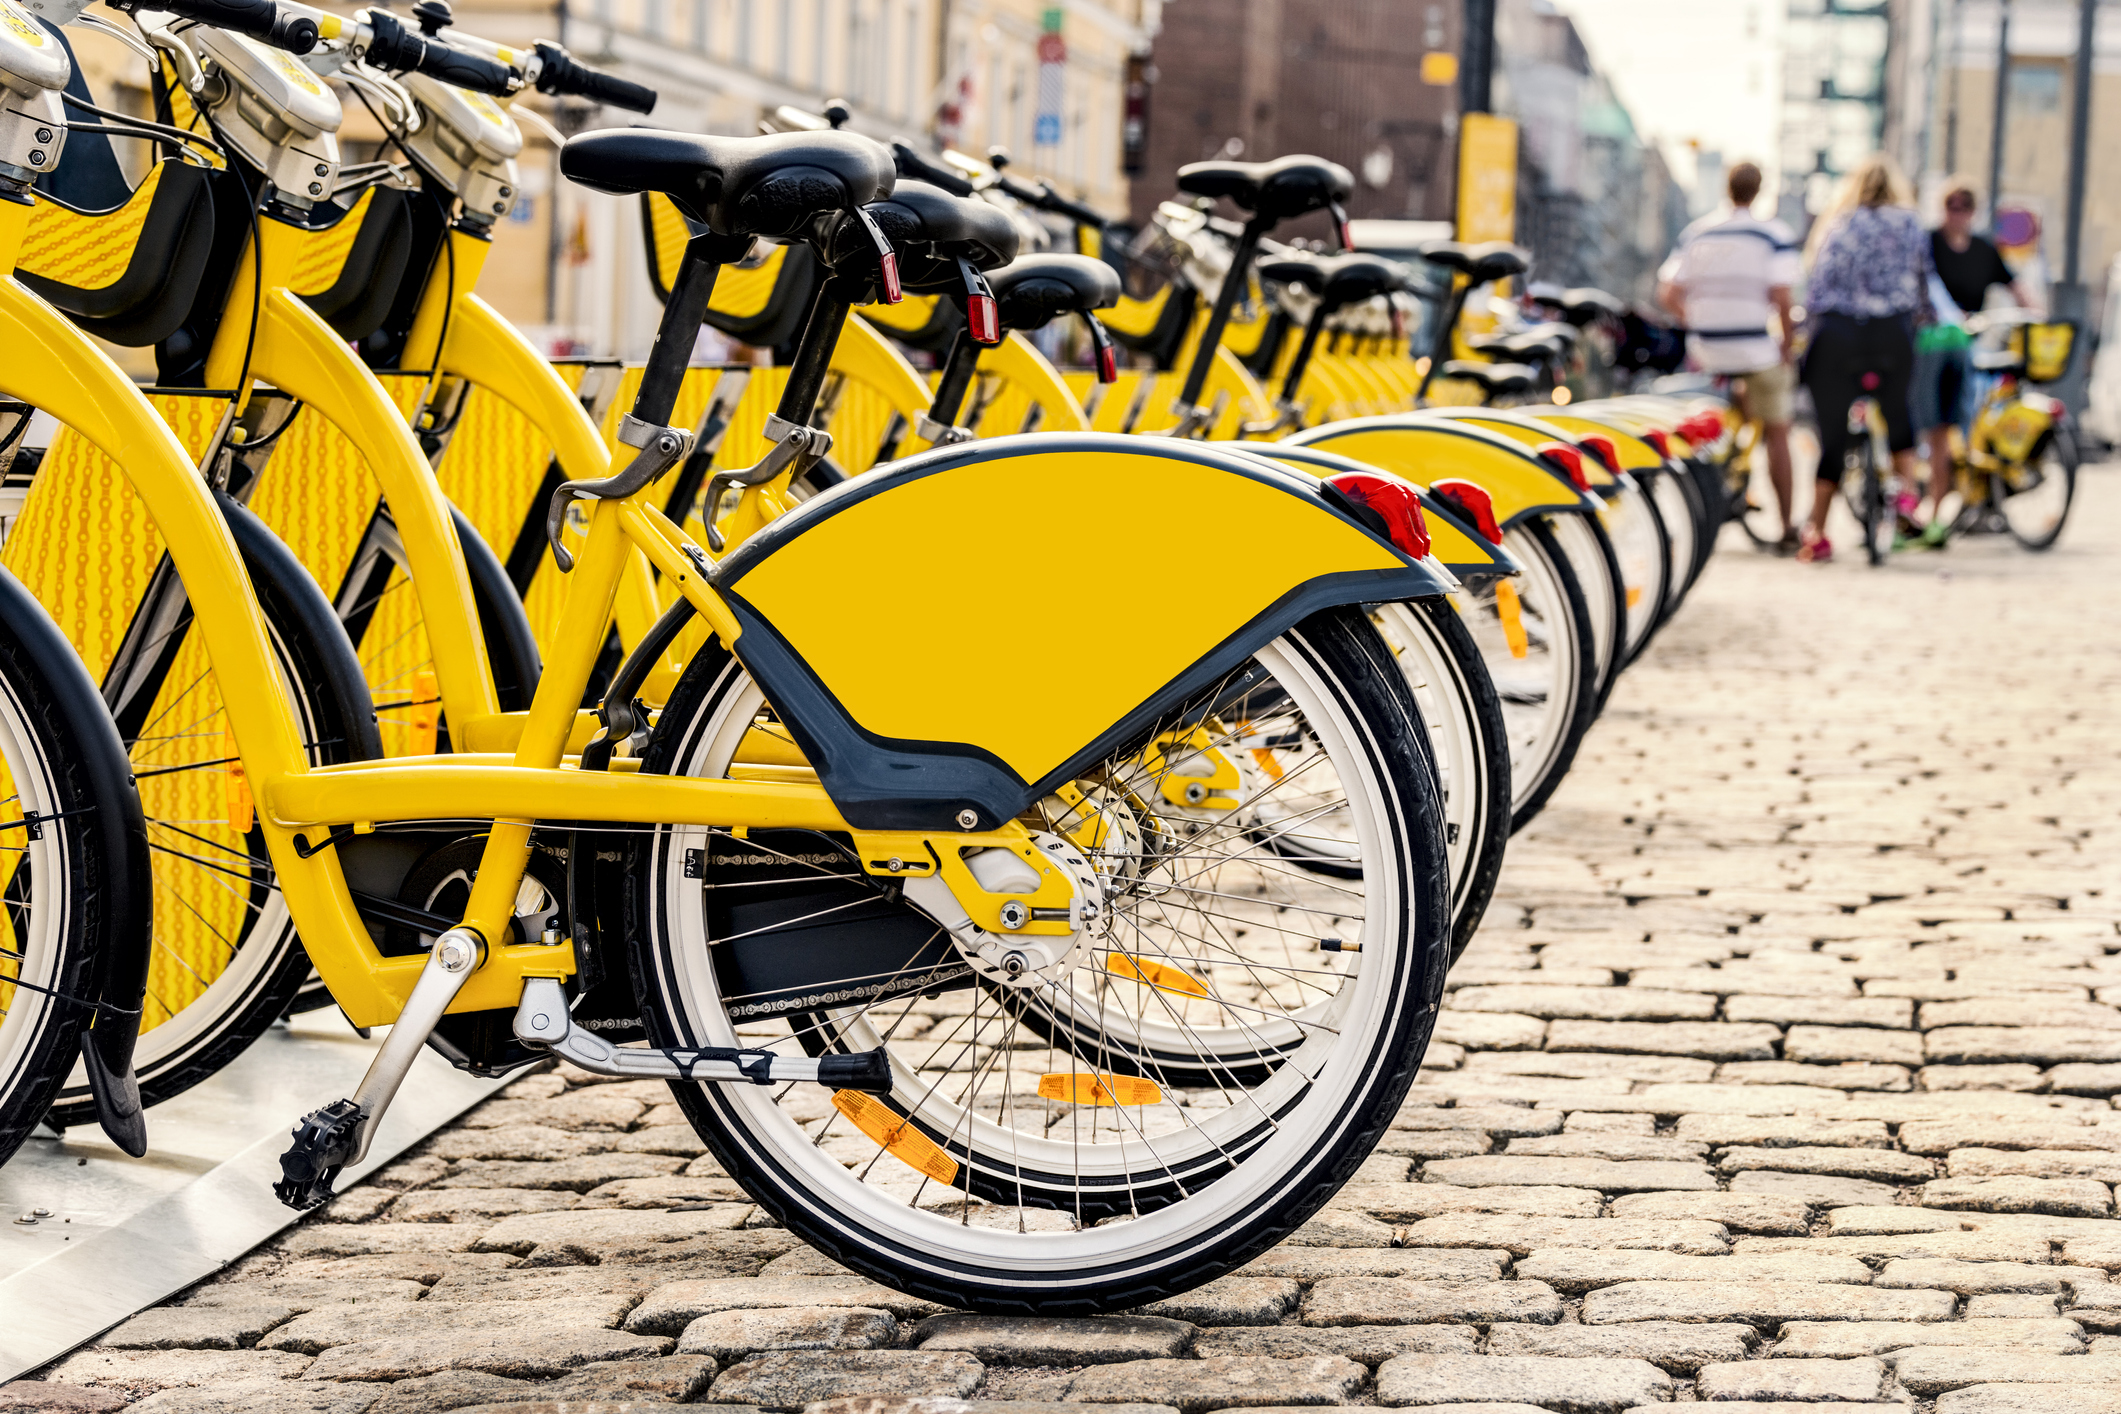
A bike share program is a shared transport service in which residents and visitors alike can hire a bike for short distances by making bicycles available to them at any hour of the day through a self-serve model.
These bikes are available throughout a city and are often found in a docking system, which is a technology-enabled bicycle rack where users can loan and return a bike. Some programs like Lyft or Bird use a dockless system in which an app identifies specific zones where you can pick up or park and lock your loaner bike.
The bikes are commonly painted in bright recognizable colors and are, increasingly, supported with an e-assist motor.
Users of bike share services have the option of paying per ride or signing up for a subscription. The majority of bike sharing programs have their own mobile applications. When taking a bike out, you can simply pick it up from one station or location and end your ride at a docking station or parking zone near your end destination.
Bike Share: Pros and Cons
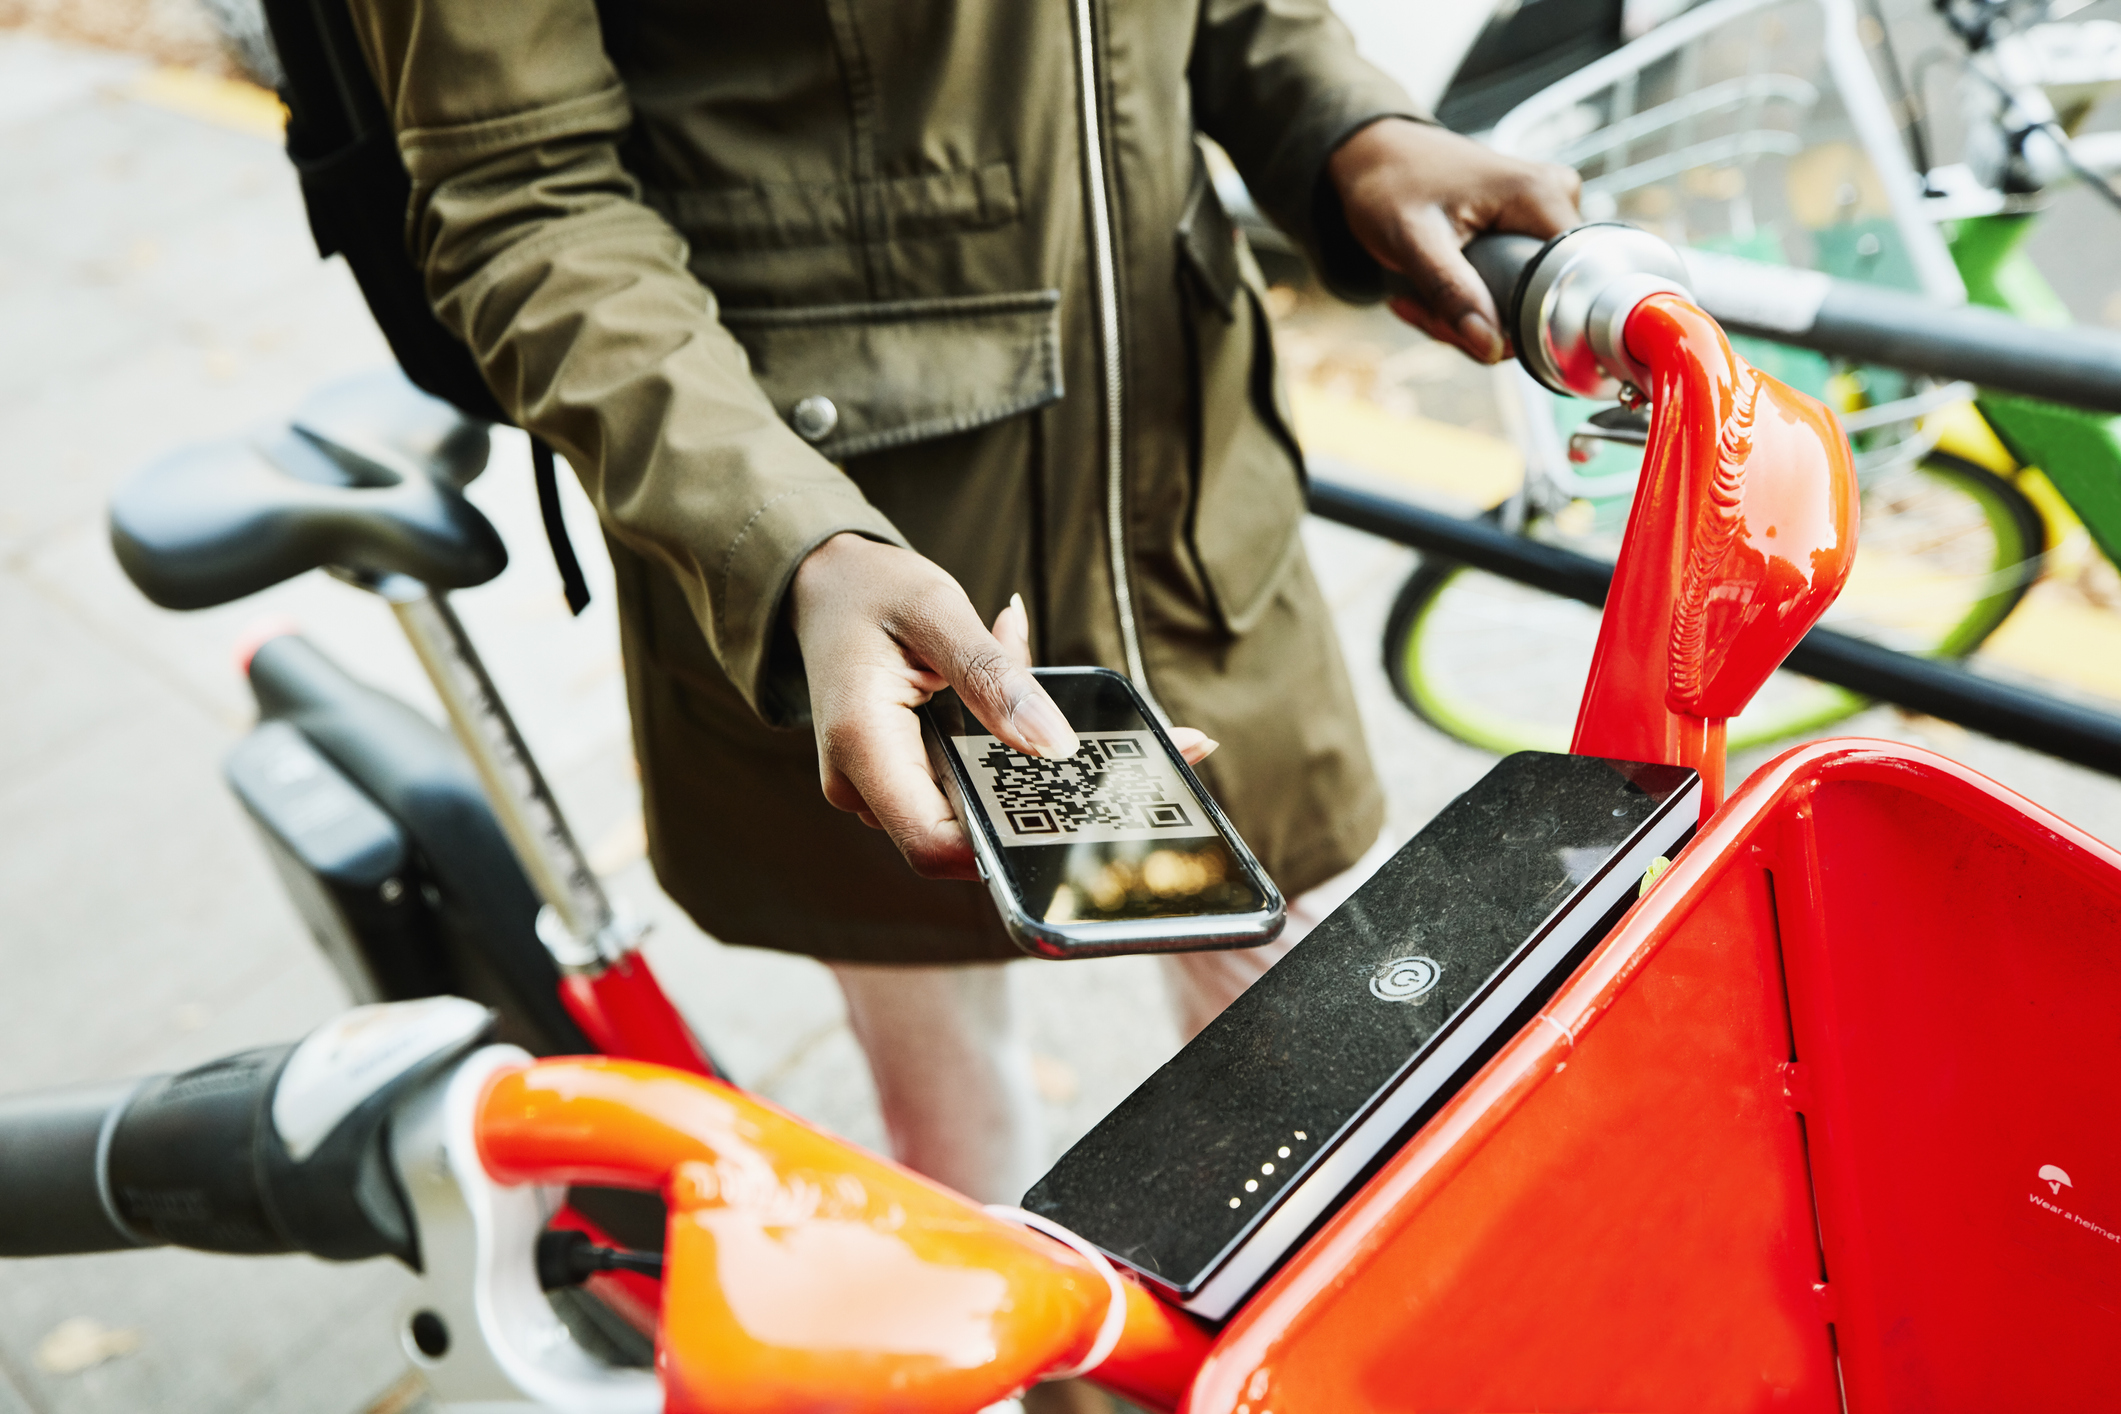
Using bike share has a lot of benefits. For one, it’s fairly easy. You can just grab a bike whenever you need one without having to own and maintain one.
These programs also have profound effects on creating a larger cycling population, increasing transit use, decreasing greenhouse gasses and improving public health, according to the Journal of Public Transportation. Many bike sharing programs take pride in their environmental contribution. For example, Montreal’s Bixi proudly states that its program has saved over 3,000,000 pounds of greenhouse gasses since inception in May 2009.
However, there are substantial drawbacks to bike sharing as well, including time constraints, a restricted supply, regional limitations and predetermined areas where a bike can be placed or picked up. All bike share bikes are not guaranteed to be available or in functioning shape because you are at the mercy of all other users.
The Journal of Public Transportation mentions that the distribution of bikes must improve to make the bike-sharing service more efficient and environmentally friendly. Staff moving bikes from areas of high supply/low demand to areas of low supply/high demand is time consuming, expensive, and polluting. Depending on the demand for bikes, programs will design "push" and "pull" stations that will either encourage trips to depart from or arrive at these stations, respectively. Free time, credit, or cash will be offered as rewards.
Cost analysis: Bike share costs in Chicago and Los Angeles
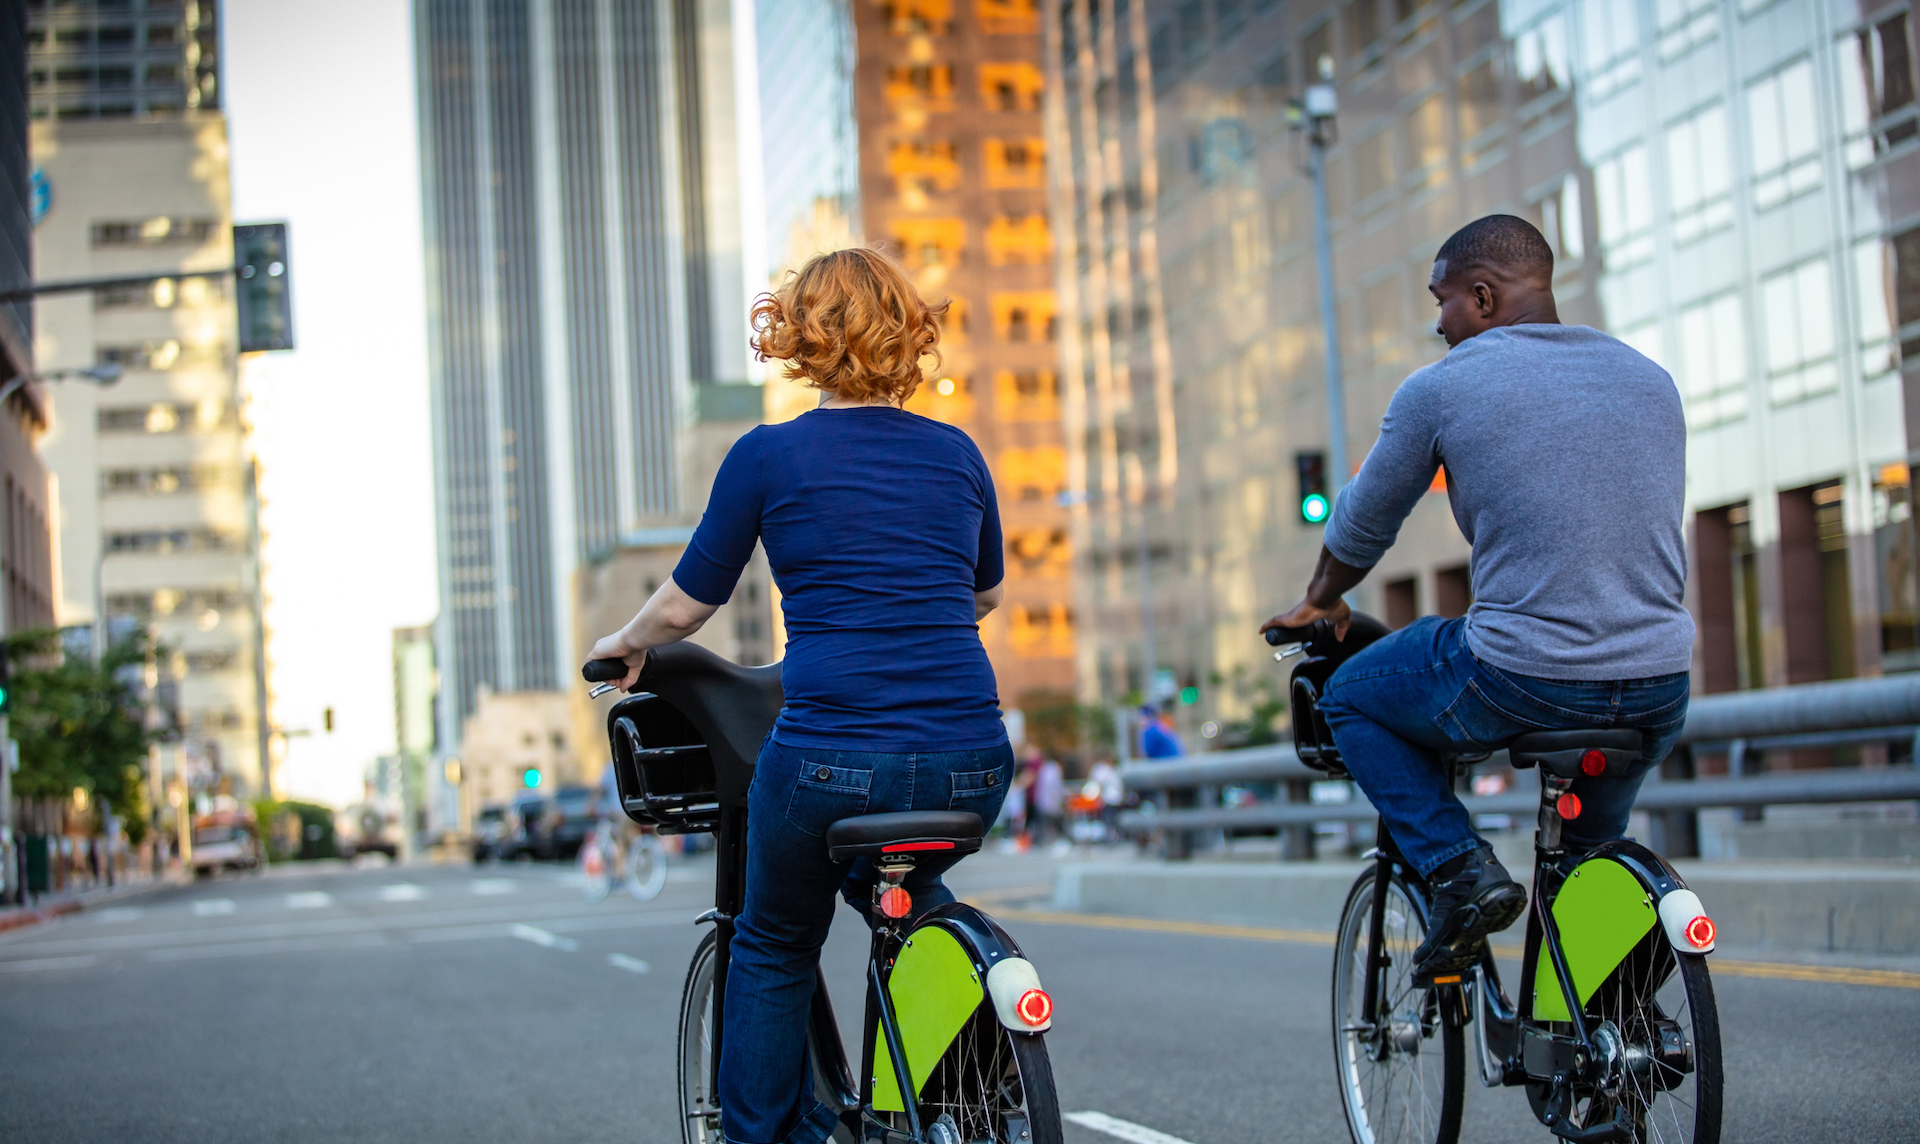
Before diving into what is the most cost-effective mode of transportation, it is essential to understand the cost of bike sharing in two of North America’s biggest cities: Chicago and Los Angeles.
Divy in Chicago offers many different programs for people wishing to bike. The single ride program is just $1 and includes the first 30 minutes of one’s ride on a classic bike. There is also an option called “the day pass,” which costs $16.50 for unlimited classic bike rides of maximum three hours at a time
An annual membership is available for $139 per year which comes out to $11 a month and it offers unlimited 45-min classic bike rides. If you keep a bike out for more than 45 minutes at a time, it's an extra $0.17 per minute.
In Los Angeles, there are several bike sharing options including Lyft, Bird and Lyme but Metro is the city-supported program. A single Metro ride costs $1.75 for every 30 minutes.
The Metro offers a 24-hour access pass which offers unlimited 30-minute rides for $5. If a ride goes over the 30-minute limit, the user will be charged an extra $1.75 every 30 minutes the ride goes on. For a 30-day pass it costs $17 per month where all rides 30 minutes or less are free. After the 30 minutes expire, it is an additional $1.75 per 30 minutes thereafter.
There is also a 365-day pass that costs $150 per year and all rides 30 minutes or less are free. For rides that go over the 30-minute limit, there’s a fee of $1.75 extra per 40 minutes.
Cost comparison: Bike-sharing versus owning a bike
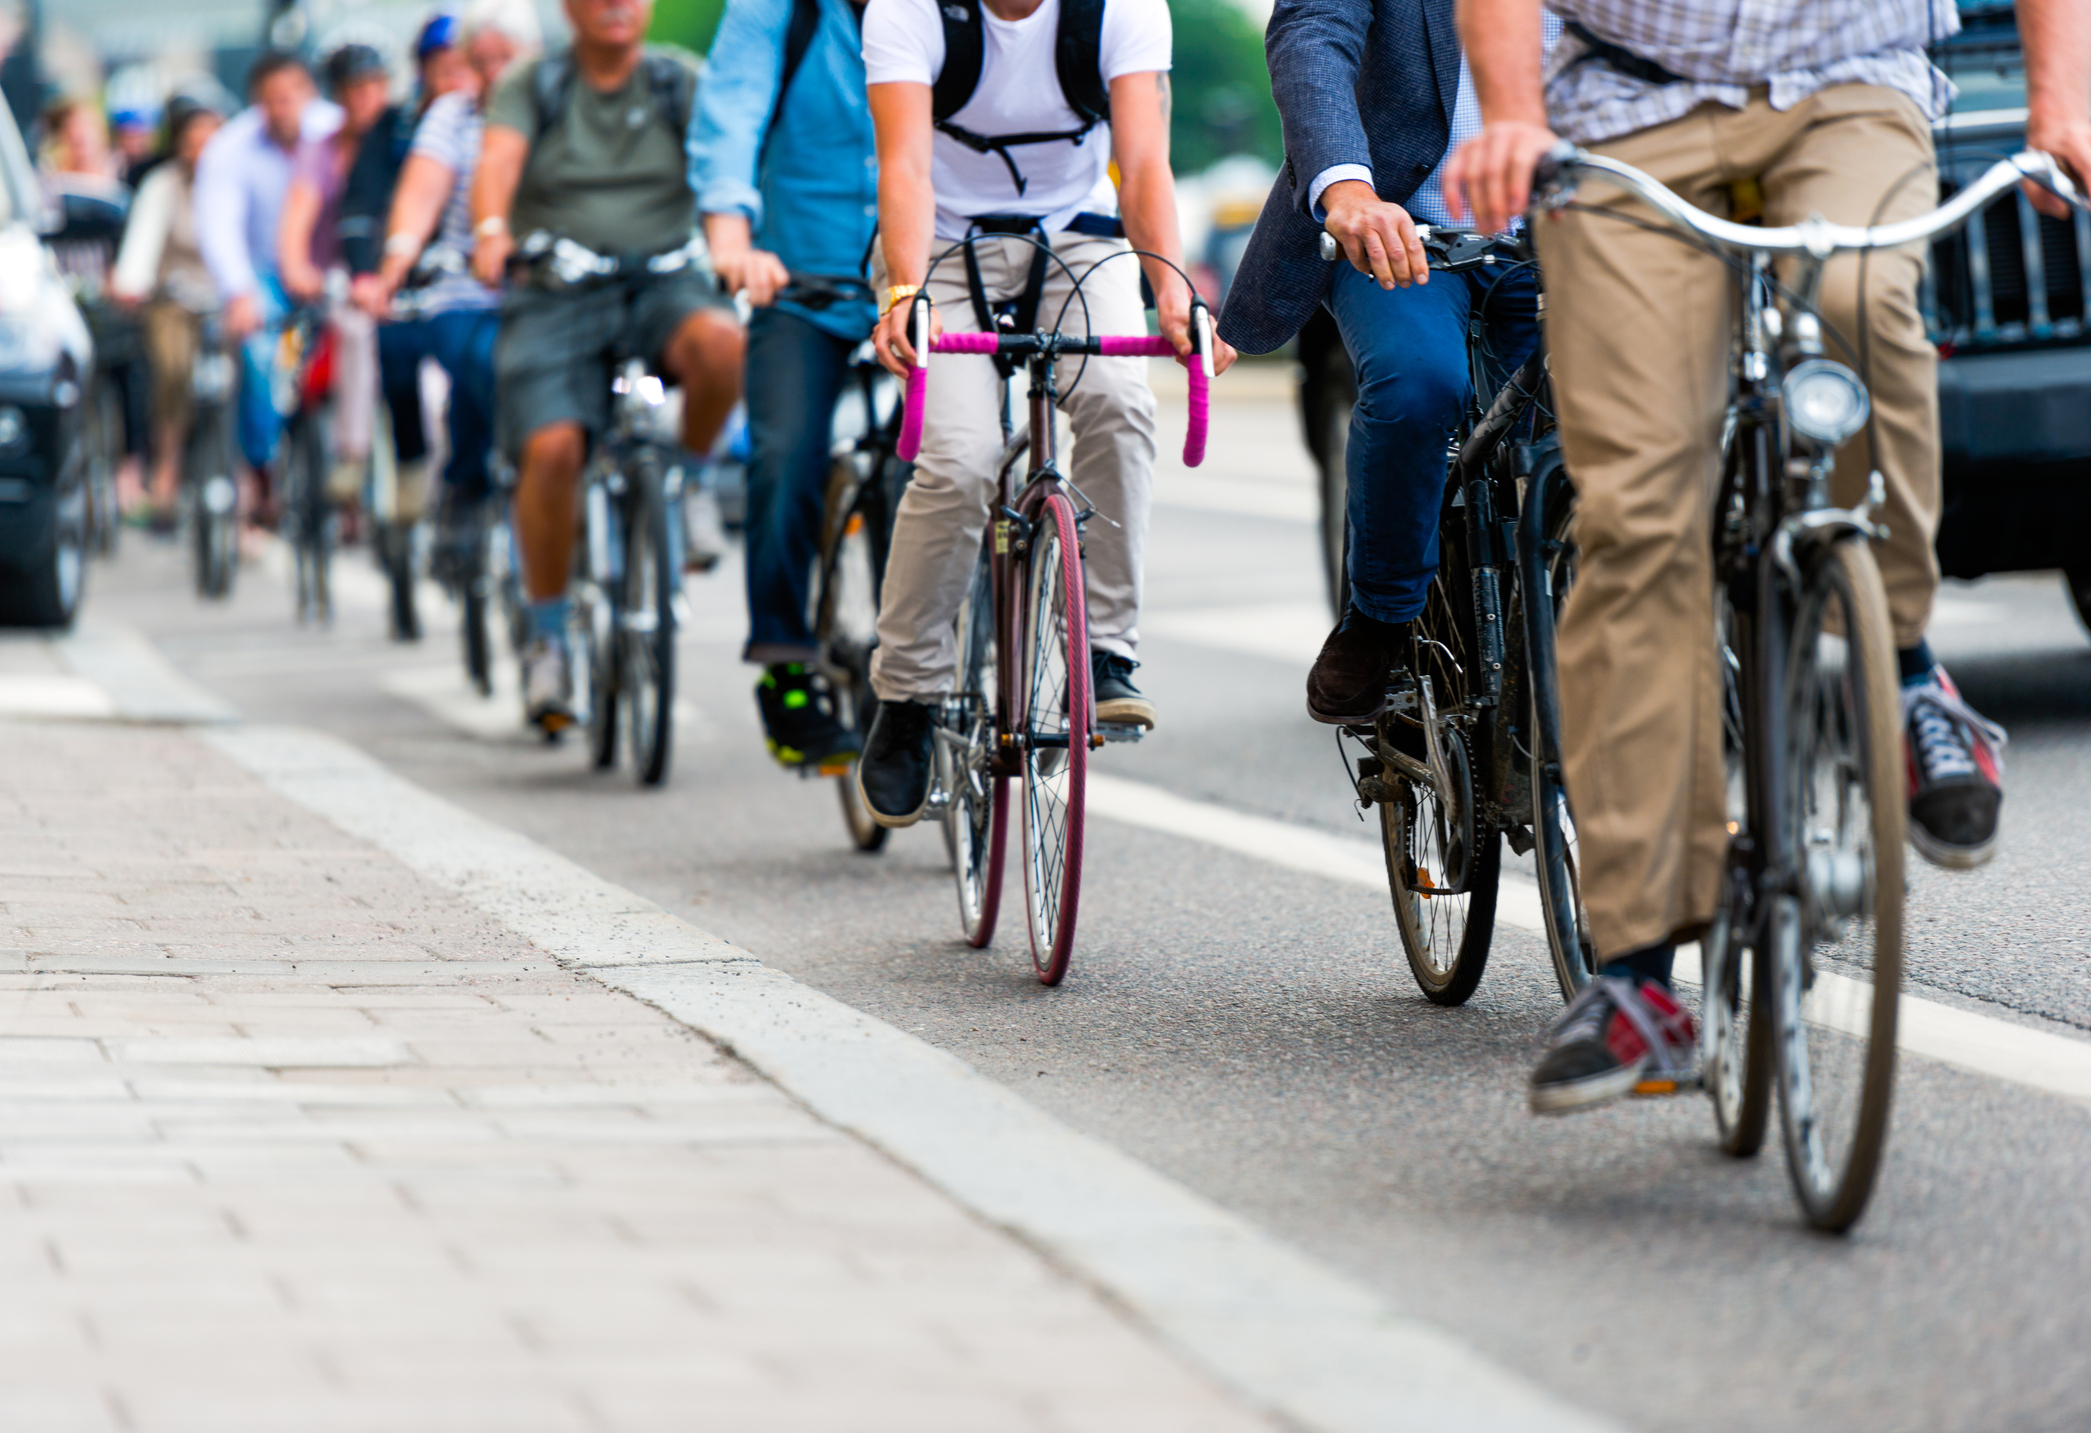
According to the urban transportation blog, Urban Country, people who commute by bike spend a grand total of $350 per year own and maintain their bike.
This sum assumes that the bike and gear (racks, fenders, etc) costs $1500 or less and you pay around $50 to maintain the bike, and you have room to store the bike.
The cost of bike sharing appears lower in comparison. However, as mentioned before, there are those downsides of not owning a bike, including restricted time and distance, limited supply and questionable dependability.
Therefore, the price of owning a bike, especially year over year, may be cheaper than bike sharing.
Cost comparison: Bike share versus ride share
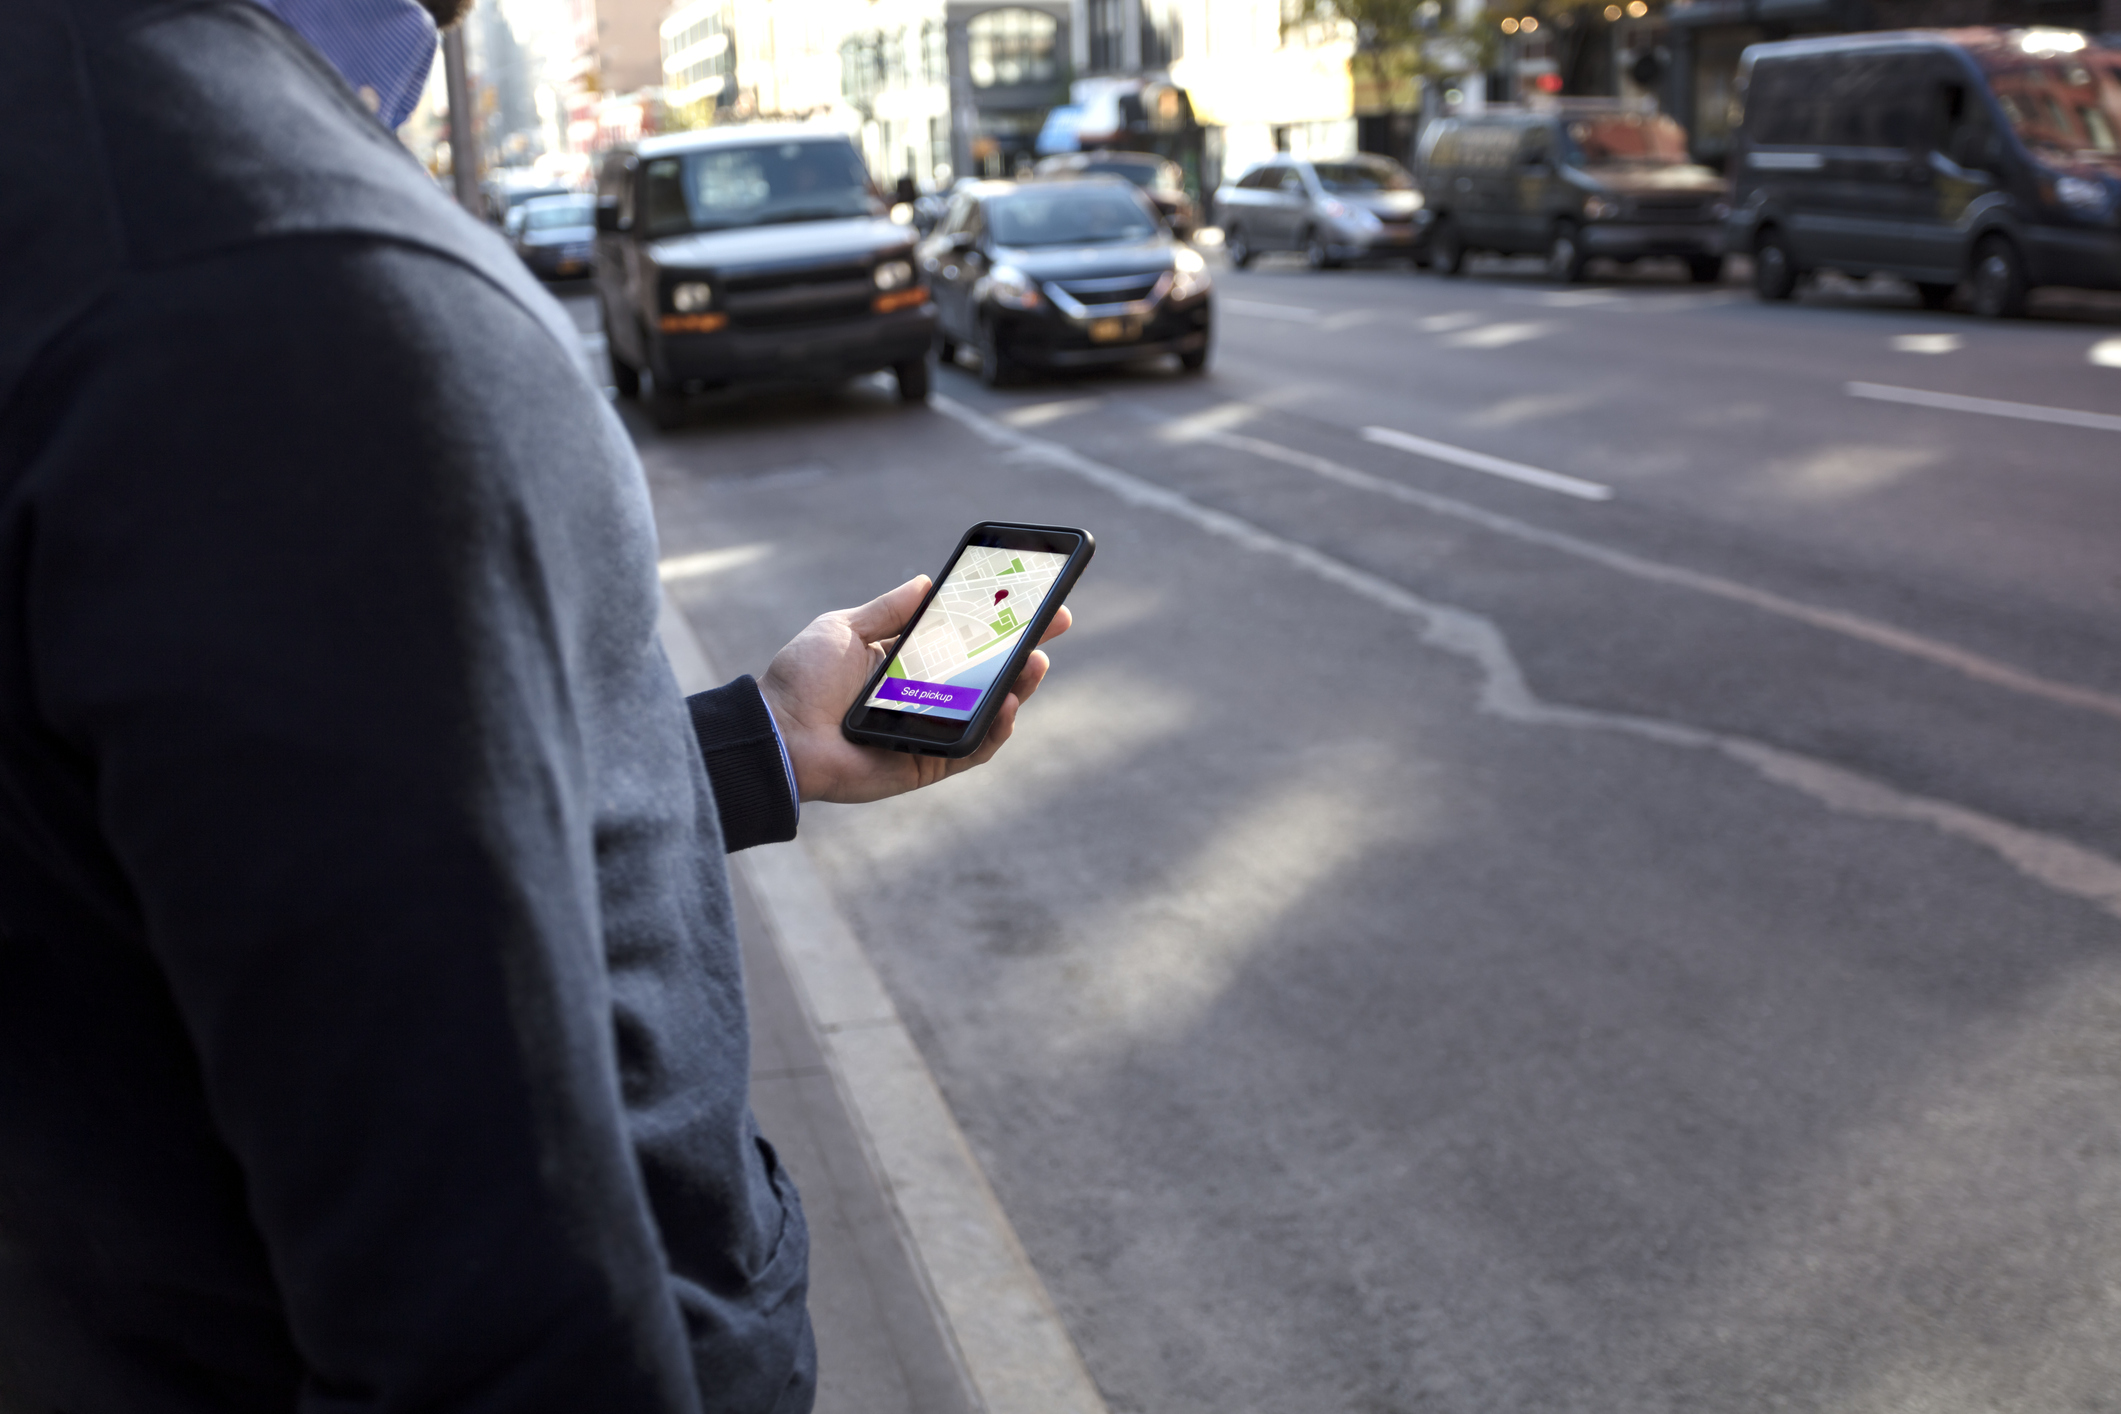
Uber is a popular mode of transportation for ride shares throughout the country. If we wanted to compare the cost of an Uber, the price estimate website serves as a way to get a fixed cost.
When looking at both Chicago and Los Angeles we will determine the cost of getting to and from the city hall to a major league stadium to compare and contrast the costs of ride sharing and bike sharing.
For Chicago, let's say a biker travels from the Thompson Center to the United Center —a 2.6-mile trip. In Los Angeles, a biker can travel from the Los Angeles City Hall to the Dodger Stadium in 2.4 miles. In each of these cities the mileage from the city hall to the major league stadium listed is approximately 2.5 miles apart.
The cost of an UberX when I checked to get to the Thompson Center to United Center was $17.93 and the cost of an UberX from Los Angeles City Hall to the Dodger Stadium was $6.93.
We do have to keep in mind though that the time the prices were checked were 4:30 C.T. which explains why prices are a bit more expensive in Chicago since it was during rush hour.
In this case, Uber can be seen as a similar price to bike sharing. However, the price of an Uber can add up overtime if people take multiple Ubers during the day which makes bike sharing the most cost effective.
The Metro in Los Angeles is the city's public transportation system and the cost of a one way ride on a bus and rail with two hours of free transfers on Metro is $1.75. A one-day pass is also available at $3.50 after the first tap with passes expiring at 3 a.m. the next day. A weekly pass is available for purchase at $12.50 that expires at 3 a.m. on the last day.
Meanwhile the Chicago Transit Authority (CTA), offers a full priced fare at $2.50 with up to Up to two additional rides within two hours free of charge. The CTA offers a one-day CTA pass at $5 and three-day pass at $15 as well as a seven day pass at $20. The monthly pass is $75.
As we can see, it is much cheaper to use public transportation as opposed to ride-sharing services for both Chicago and Los Angeles.

Cost comparison: Bike share versus owning a car
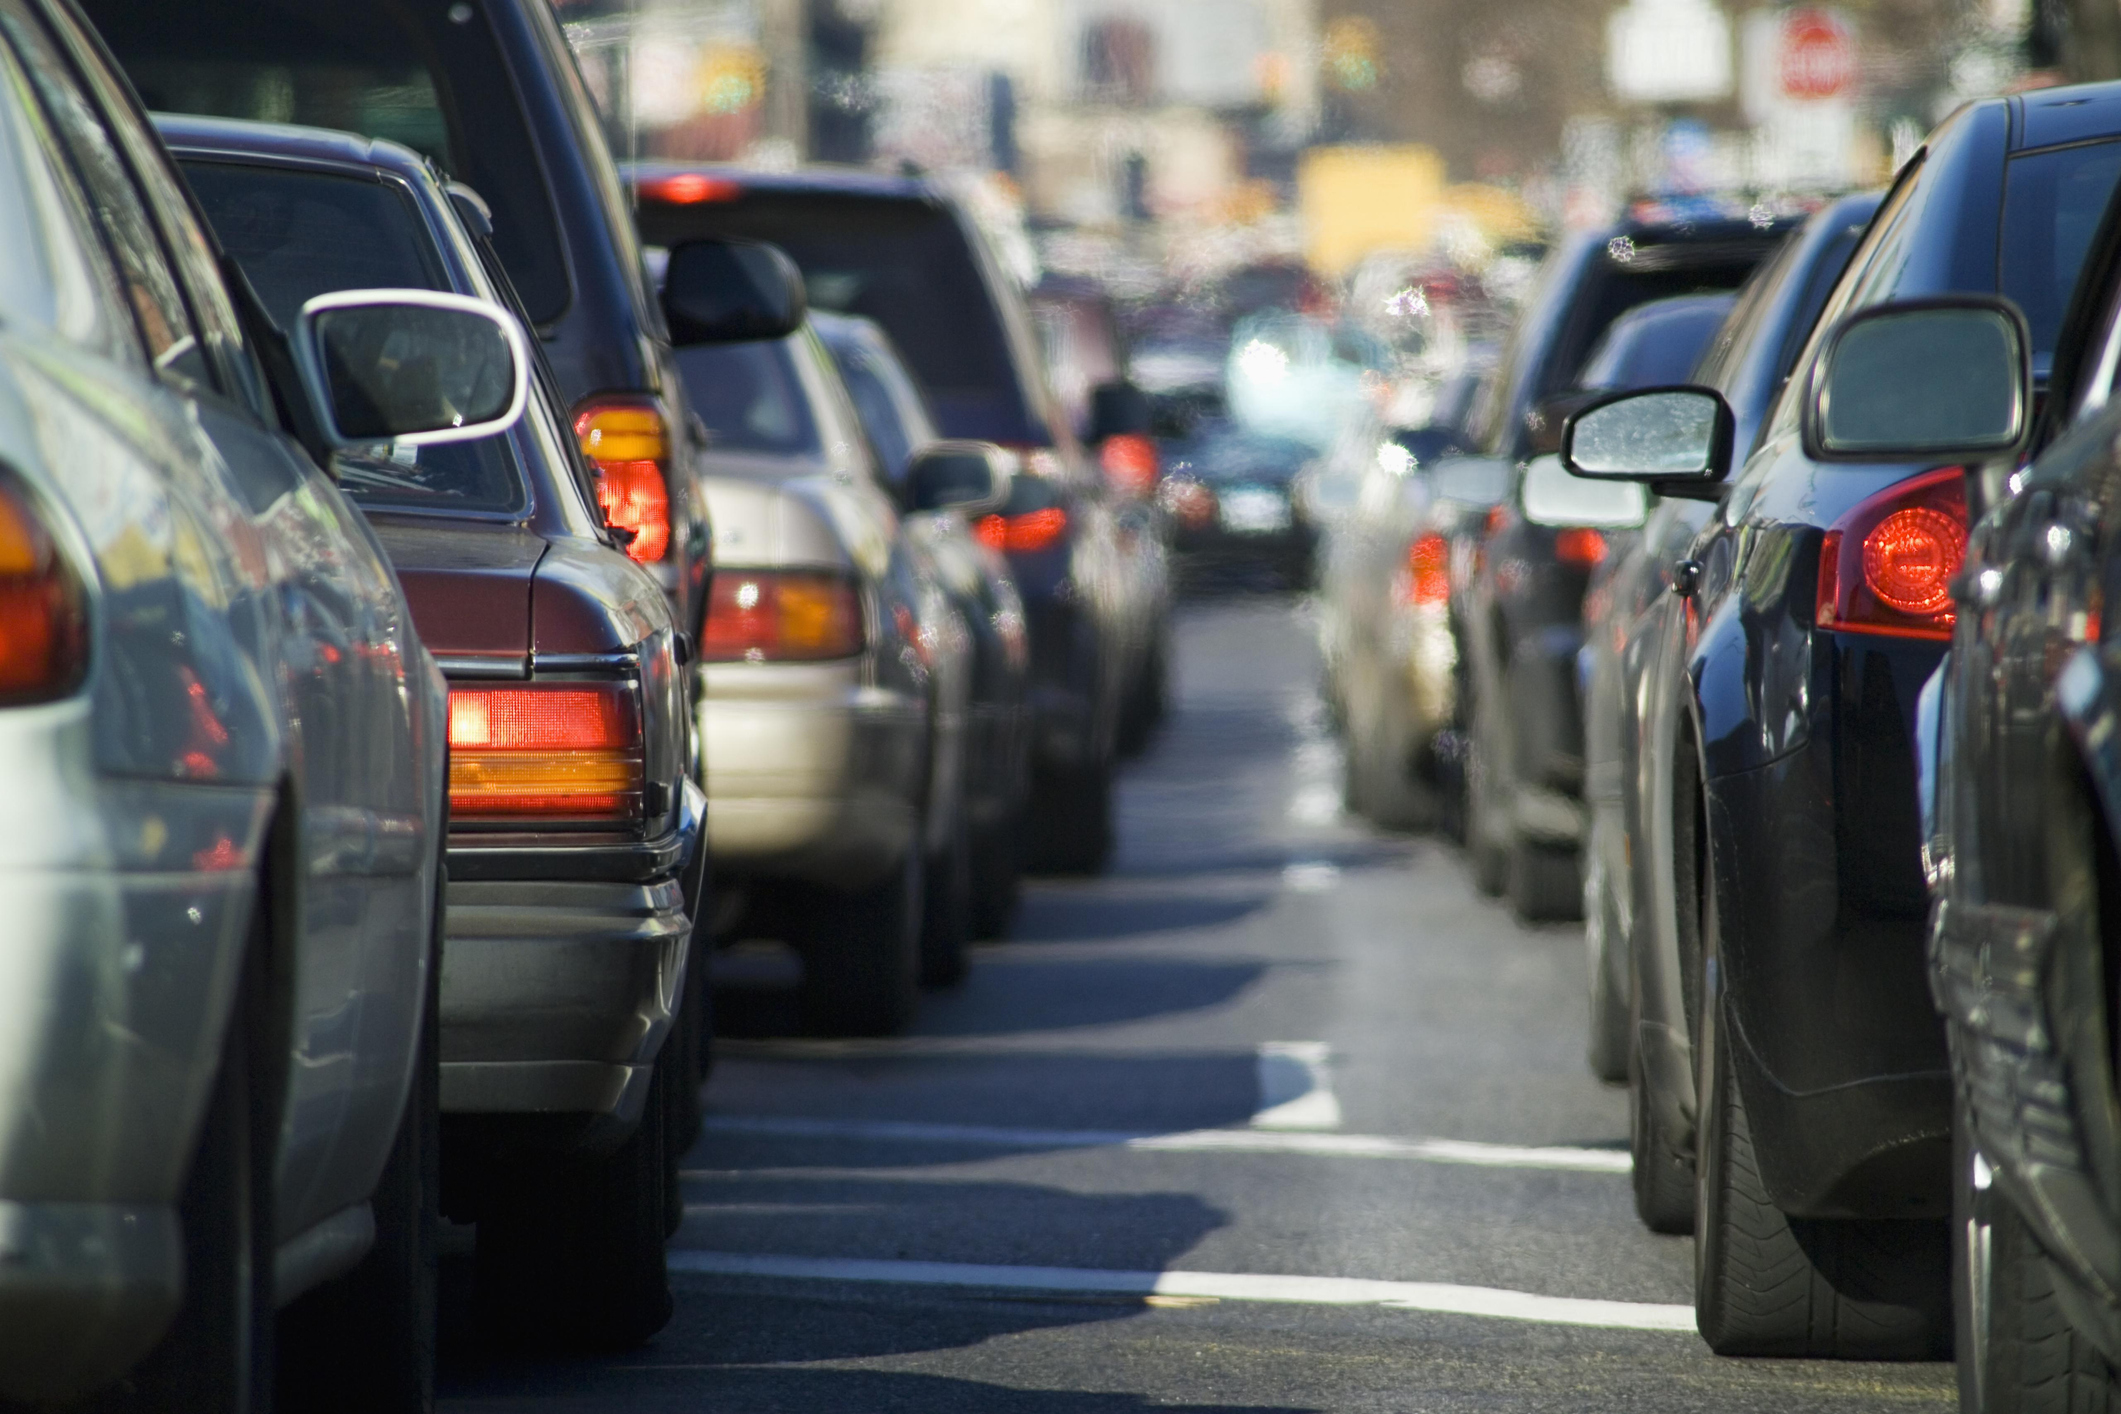
Owning a car has its own pros and cons. According to the AAA, the average annual cost of new vehicle ownership climbed to $9,282, or $773.50 a month which is an increase of $433 – or nearly 5% – from last year.
According to Insurify, the cost of owning and maintaining a car for yearly insurance, tax, gas and maintenance costs is $4,796 and the average cost of car insurance for 2022 is $1,357. The effective vehicle tax rate is at 0.65% and the cost of a regular gallon of gas in August 2022 was $5.31.
For Illinois, the cost of owning and maintaining a car for yearly insurance, tax, gas and maintenance costs is $3,972 and the average cost of car insurance for 2022 was $1,154. The effective vehicle tax rate is at 0% and the cost of a regular gallon of gas for August 2022 was at $4.23.
Meanwhile, in California the cost of owning a car which includes yearly insurance, tax, gas and maintenance costs is at $4,796. The average cost of car insurance for 2022 was $1,357 and the effective vehicle tax rate is at 0.65%. The cost of a regular gallon of gas for August was $5.31.
It is also worth noting gas prices rose in January of 2023, contributing to a higher inflation print for that month according to CNBC. It can be noted how bike-sharing is the cheaper mode of transportation. However, in bike-sharing people do not have the luxury of having their own vehicle.

Conclusion
Bike sharing provides numerous benefits to the environment and personal health while also being a viable way to move oneself throughout a city. And depending on the circumstances and purpose for traveling, bike sharing can certainly be cost-effective, but in the cities of Chicago or Los Angeles, it is not the most cost-effective mode of traveling.
The best mode of traveling, that is to say, the most cost-effective mode, is actually owning a bike.
The second most cost-effective mode of traveling through Chicago or Los Angeles, is taking public transportation such as trains or buses. Especially when you're covering greater distances or when dealing with Chicago's grueling winters, taking public transportation over riding a bike makes the most sense.
But if the weather is fine and you're looking to stretch your legs, bike share is still cheaper than ride share or owning a vehicle of your own.


