While the major U.S. stock-market indexes bottomed in October, many megacap stocks did not bottom until early January.
Names like Apple (AAPL), Amazon (AMZN) and Tesla (TSLA) are a few that come to mind. Despite the selling pressure, though, the markets handled the action in these names pretty well.
Don't Miss: Meta Has Been the Best FAANG Performer in '23; Where From Here?
Earlier this week, Apple stock caught a lift following positive comments from the analysts at Goldman Sachs.
Then on Tuesday, Goldman Sachs named Amazon as a top pick. It was also named a high-conviction stock by Morningstar a few weeks ago.
Still, Amazon stock continues to struggle to gain traction. The stock is down in three of the past four weeks and is trying to avoid turning that stretch into four weeks out of the past five. It's down about 2% so far this week.
Let’s take a look at the stock, as Amazon shares are clearly not out of the woods yet.
Trading Amazon Stock

Chart courtesy of TrendSpider.com
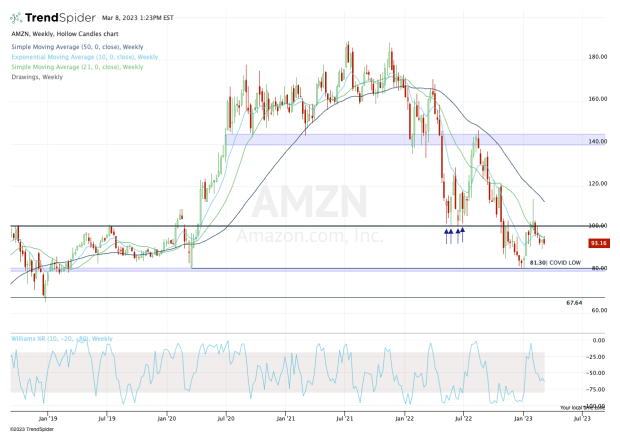
The weekly chart has issues everywhere. Perhaps the biggest one is that the stock has been unable to regain and hold $100.
While this level is psychologically relevant, it’s also been a key pivot over the past few years.
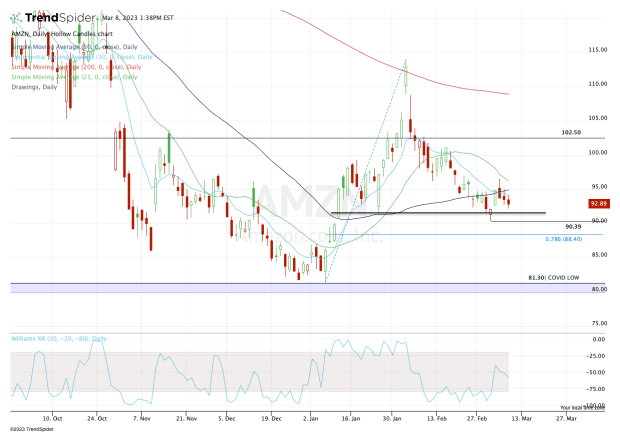
Notice also that Amazon stock is below all its key weekly moving averages, an issue that also persists on the daily chart shown below.

Chart courtesy of TrendSpider.com
Right now, the bulls want to see Amazon stock hold the $90 to $91 area. This level has been support so far in 2023. If it’s lost, traders will have to adjust their outlook on the stock.
On the downside, the 78.6% retracement stands out near $88.50, followed by a small gap-fill level near $86.50.
Below that and we could be talking about another trip down to the low-$80s. That’s where Amazon found support in early January and it also marks the covid low from 2020, at $81.30.
For long-term investors, they might consider accumulating a small stake in Amazon stock in this zone, as it would imply that shares are down about 55% from the all-time high.
On the upside, a move over $96 would put Amazon stock above the 10-day, 21-day and 50-day moving averages. That would open the door back to $100-plus and potentially put the declining 200-day moving average back in play near $110.


