Alibaba Group Holdings, Ltd (NYSE:BABA) soared over 37% higher on Wednesday, completely erasing the decline the stock has suffered over the past eight trading days.
The beaten down Shanghai-based tech giant has been in free fall since reaching an all-time high of $319.32 on Oct. 27, 2020, but on Monday, Canadian entrepreneur and investor Kevin O’Leary called the bottom in Chinese stocks and said he had purchased Alibaba shares. The stock fell about 5% lower the following day, but if Wednesday’s price action is any indication of what’s to come, O’Leary is set to profit greatly.
O'Leary will be the keynote speaker at the inaugural Benzinga Psychedelics Capital Conference on April 19 in Miami Beach.
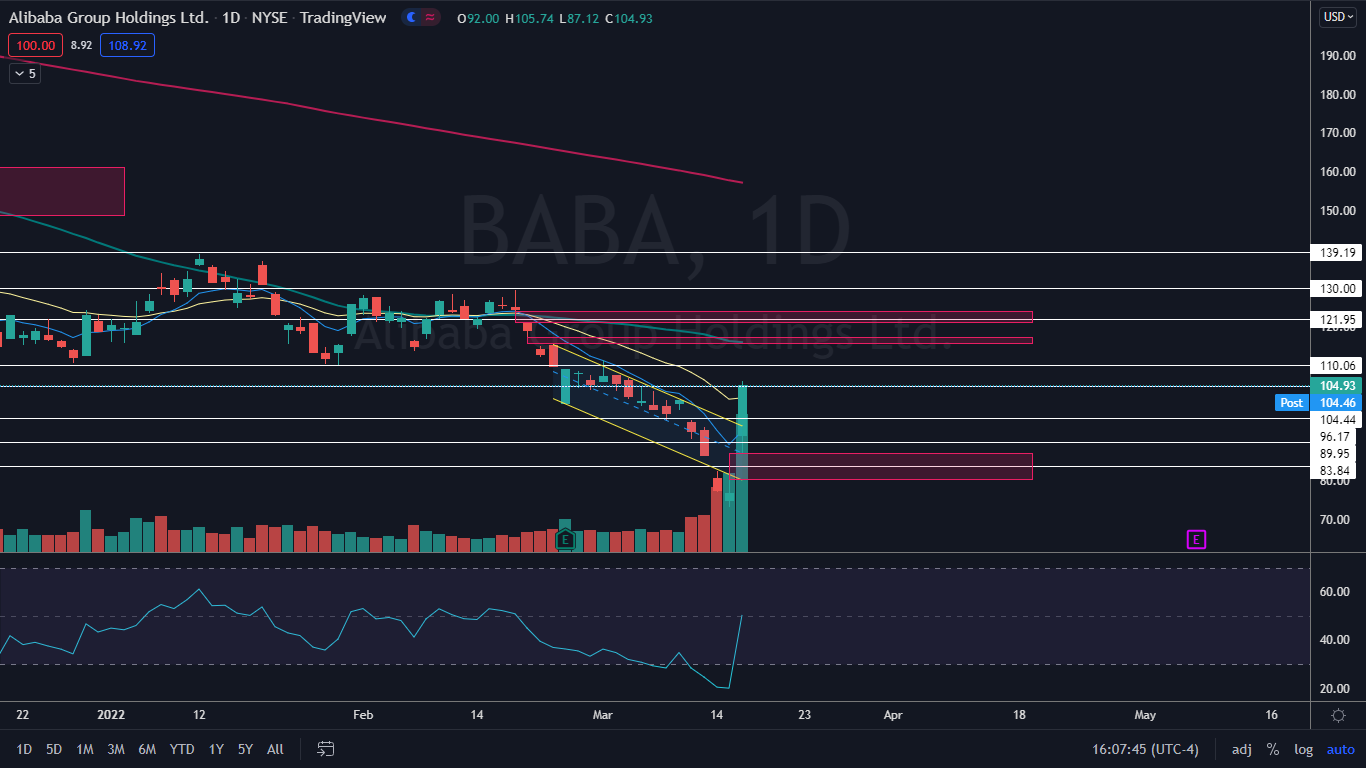
The Alibaba Chart: On Monday, Alibaba broke bearishly through a falling channel pattern on the daily chart, which ended up being a bear trap because on Wednesday the stock opened the trading session back within the pattern and broke up bullishly through it on higher-than-average volume.
- A whopping 150 million shares of Alibaba exchanged hands on Wednesday, compared to the 10-day average of 36.45 million. The massive increase in volume indicates a huge amount of trader and investor interest has returned to the stock.
- On Wednesday, Alibaba printed a bullish kicker candlestick pattern, which indicates higher prices or even a second gap-up-open could come on Thursday. If the stock does gap up to start the day, bearish traders can watch for a three-gap-up reversal pattern to come on Friday, which could indicate the stock will trade lower next week to print a higher low in its new uptrend.
- If higher prices don’t come on Thursday, Alibaba may print an inside bar pattern on the daily chart, which in this case would be bullish because the stock was trading higher before forming the pattern.
- Alibaba has multiple gaps on the chart, which are about 90% likely to fill in the future. The two closest gaps fall between $115.40 and $117.20 and $120.88 and $124.06 and if Alibaba rises up to fill the higher gap, it will represent a further 18% increase in share price.
- Alibaba has resistance above at $104.44 and $110.06 and support below at $96.17 and $89.95.
See Also: US Tiger Securities Analyst Upgraded Chinese Tech Sector - Read Why
Photo: Courtesy of Leon Lee on Flickr