Alibaba Group Holdings, Ltd (NYSE:BABA) was holding strong compared to the general markets on Wednesday, trading mostly flat despite the SPDR S&P 500 falling almost 1% lower at one point.
On Tuesday, it was reported Alibaba has partnered with Canaan Inc (NASDAQ:CAN) to develop operating systems for artificial intelligence chips. The global chip shortage continues to plague manufacturers of electronics and the Chinese Communist Party has been pushing Alibaba to design its own processing chips in an effort to become less reliant on the U.S., Europe, Japan, Taiwan, and South Korea for components.
Alibaba has been severely beaten down since Oct. 27, 2020, when the stock reached an all-time high of 319.32. Since that date, the stock has lost over 65% of its value to reach a low of 110.06 on Jan. 28 of this year.
The stock may have found a bottom at that level, however, because it has begun to show signs that a powerful reversal may be on the horizon.
See Also: Here's What Happened Between China Regulator And Alibaba, Tencent
The Alibaba Chart: After reaching the $110 level, Alibaba reversed course into an uptrend, with the most recent higher low created on Monday at the $119.37 mark and the most recent higher high formed at $128.34 on Feb. 10. For the stock to continue its current trend, it will soon need to print another higher high above that level.
Technical traders may have seen the uptrend coming because when Alibaba reached the Jan. 28 low it printed a hammer candlestick on the daily chart and combined with the same candlestick printed near that same level on Dec. 3, 2021 and Dec. 29, the stock formed a bullish triple bottom pattern.
Alibaba has a number of gaps on its chart that are above the current share price. Gaps on charts fill about 90% of the time, so it is likely the stock will trade up to fill each range in the future. The closest gap falls between $148.50 and $161.14 and if Alibaba rises to fill the gap it would represent an increase of 28.28% from the current share price.
Alibaba is trading above the eight-day and 21-day exponential moving averages (EMAs), with the eight-day EMA trending above the 21-day, both of which are bullish indicators. The stock is also trading above the 50-day simple moving average, which indicates longer term sentiment has become bullish.
Want direct analysis? Find me in the BZ Pro lounge! Click here for a free trial.
- Bulls want to see big bullish volume come in and push Alibaba up above a resistance level at $130, which would cause the stock to print a higher high. Above that level, there is resistance at $139.19 and $147.95.
- Bears want to see big bearish volume come in and drop Alibaba down below the Feb. 14 low-of-day, which would negate the uptrend. There is support below at $110.06 and $104.44.
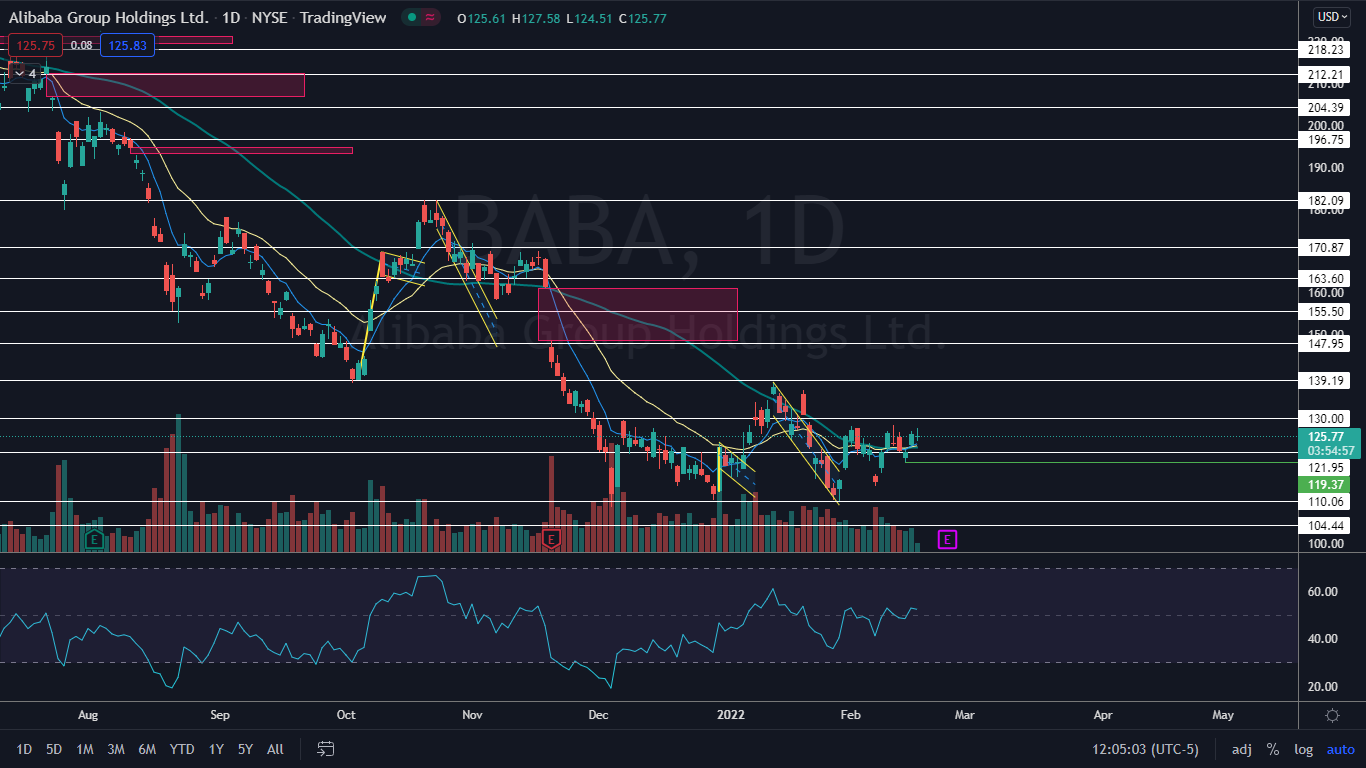
Photo: Courtesy of Daniel Cukier on Flickr