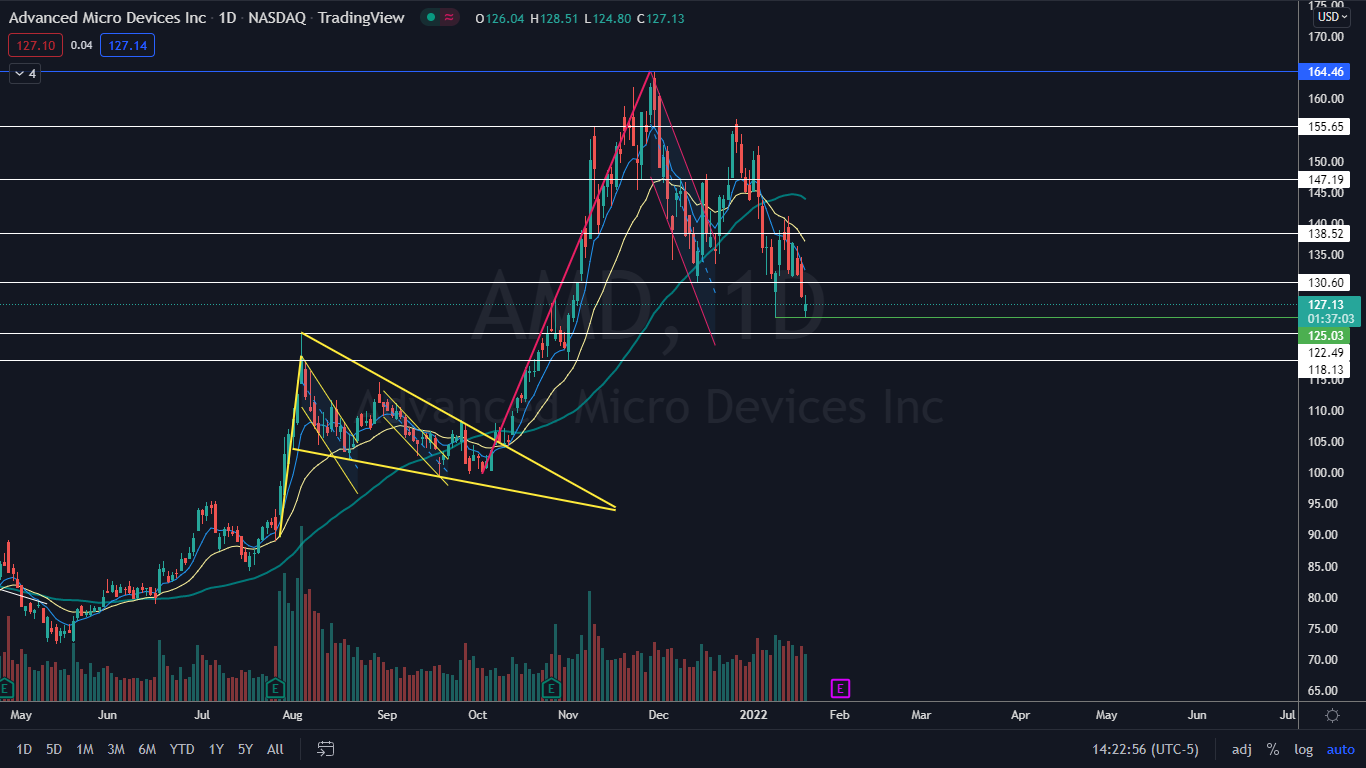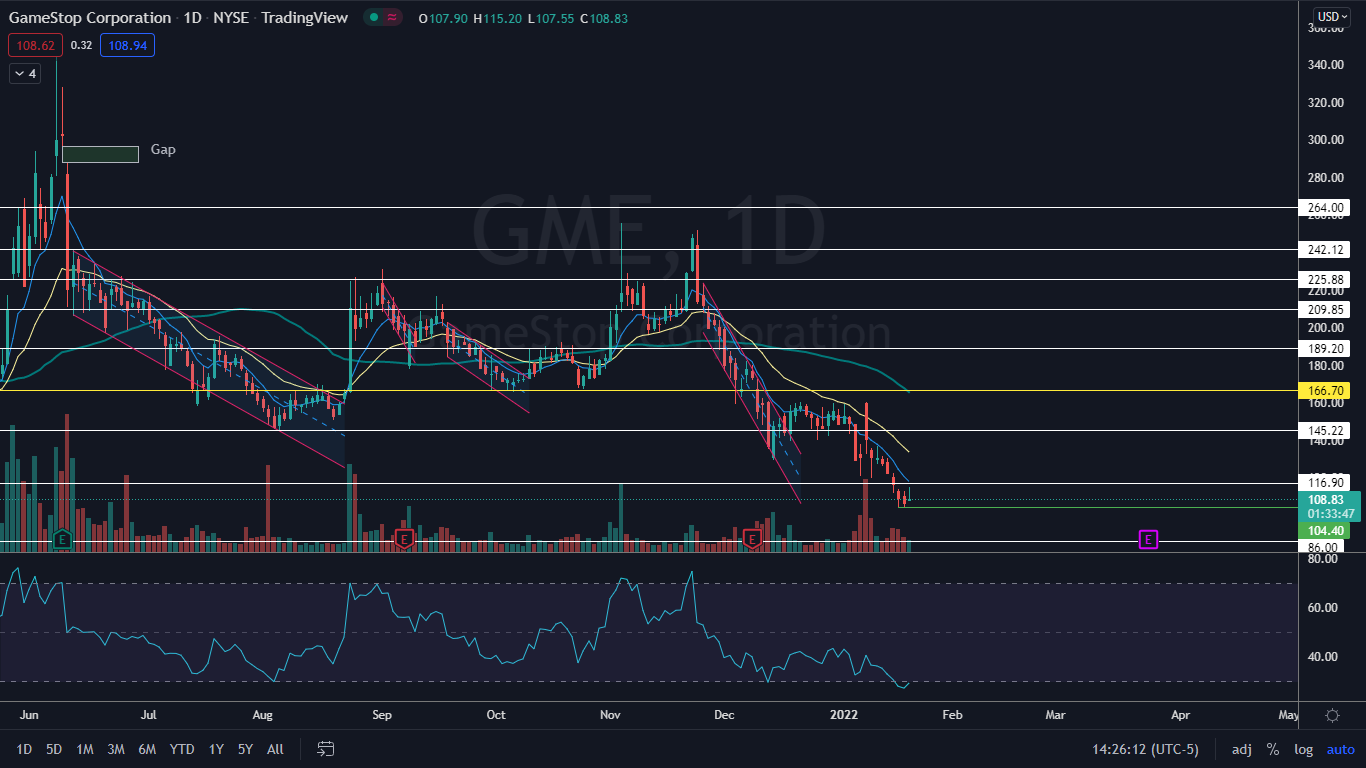
Advanced Micro Devices, Inc (NASDAQ:AMD) and GameStop Corporation (NYSE:GME) have created double bottom and triple bottom patterns on the daily chart.
A double bottom pattern is a reversal indicator that shows a stock has dropped to a key support level, rebounded, back tested the level as support and is likely to rebound again. It's possible the stock may retest the level as support again, creating a triple bottom or even quadruple bottom pattern.
The formation is always identified after a security has dropped in price and is at the bottom of a downtrend, whereas a bearish double top pattern is always found in an uptrend. A spike in volume confirms the double bottom pattern was recognized and subsequent increasing volume may indicate the stock will reverse into an uptrend.
- Aggressive bullish traders may choose to take a position when the stock’s volume spikes after the second retest of the support level. Conservative bullish traders may wait to take a position when the stock’s share price has surpassed the level of the initial rebound (the high before the second bounce from the support level).
- Bearish traders may choose to open a short position if the stock rejects at the level of the first rebound or if the stock falls beneath the key support level at which it created a double bottom pattern.
See Also: Wall Street Fund Managers Tracking Retail Traders On Social Media And Message Boards
The Advanced Micro Devices Chart: On Thursday, AMD was printing a double bottom pattern at the $125.03 mark when combined with the price action at the level on Jan. 10.
- If the pattern is recognized, AMD should pop up over the following trading days to print a “W” pattern on the daily chart.
- If AMD closes the trading day near to its opening price, it will print a doji candlestick, which is found at the bottom of a trend and could indicate the stock will trade higher on Friday.
- AMD has resistance above at $130.60 and $138.52 and support below at $122.49 and $118.13.
Want direct analysis? Find me in the BZ Pro lounge! Click here for a free trial.

The GameStop Chart: GameStop printed a double bottom pattern on its daily chart on Tuesday and Wednesday, and on Thursday the stock attempted to break up from the formation but rejected near a resistance level at $116.
- GameStop’s relative strength index (RSI) is measuring low at 30%. When a stock’s RSI reaches or exceeds that level it becomes oversold, which can be a buy signal for technical traders.
- GameStop was trading on well below-average-volume on Thursday, which indicates the stock may be in a period of consolidation.
- GameStop has resistance above at $116.90 and $129.50 and support below at $99.97 and $86.


