Burlington Stores (NYSE:BURL) is preparing to release its quarterly earnings on Tuesday, 2024-11-26. Here's a brief overview of what investors should keep in mind before the announcement.
Analysts expect Burlington Stores to report an earnings per share (EPS) of $1.54.
Anticipation surrounds Burlington Stores's announcement, with investors hoping to hear about both surpassing estimates and receiving positive guidance for the next quarter.
New investors should understand that while earnings performance is important, market reactions are often driven by guidance.
Earnings Track Record
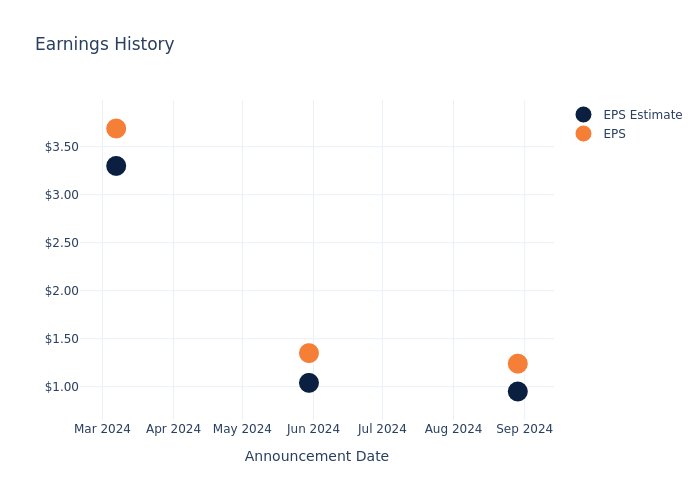
Last quarter the company beat EPS by $0.29, which was followed by a 0.4% increase in the share price the next day.
Here's a look at Burlington Stores's past performance and the resulting price change:
| Quarter | Q2 2024 | Q1 2024 | Q4 2023 | Q3 2023 |
|---|---|---|---|---|
| EPS Estimate | 0.95 | 1.04 | 3.30 | 0.99 |
| EPS Actual | 1.24 | 1.35 | 3.69 | 1.10 |
| Price Change % | 0.0% | 2.0% | -2.0% | 4.0% |

Burlington Stores Share Price Analysis
Shares of Burlington Stores were trading at $286.17 as of November 22. Over the last 52-week period, shares are up 66.96%. Given that these returns are generally positive, long-term shareholders are likely bullish going into this earnings release.
Analyst Views on Burlington Stores
For investors, grasping market sentiments and expectations in the industry is vital. This analysis explores the latest insights regarding Burlington Stores.
With 11 analyst ratings, Burlington Stores has a consensus rating of Buy. The average one-year price target is $309.36, indicating a potential 8.1% upside.
Peer Ratings Overview
The below comparison of the analyst ratings and average 1-year price targets of Gap, Abercrombie & Fitch and Boot Barn Holdings, three prominent players in the industry, gives insights for their relative performance expectations and market positioning.
- The consensus outlook from analysts is an Neutral trajectory for Gap, with an average 1-year price target of $27.8, indicating a potential 90.29% downside.
- The consensus among analysts is an Neutral trajectory for Abercrombie & Fitch, with an average 1-year price target of $185.62, indicating a potential 35.14% downside.
- For Boot Barn Holdings, analysts project an Buy trajectory, with an average 1-year price target of $171.56, indicating a potential 40.05% downside.
Summary of Peers Analysis
Within the peer analysis summary, vital metrics for Gap, Abercrombie & Fitch and Boot Barn Holdings are presented, shedding light on their respective standings within the industry and offering valuable insights into their market positions and comparative performance.
| Company | Consensus | Revenue Growth | Gross Profit | Return on Equity |
|---|---|---|---|---|
| Burlington Stores | Buy | 13.37% | $1.06B | 7.02% |
| Gap | Neutral | 2.93% | $1.58B | 9.08% |
| Abercrombie & Fitch | Neutral | 21.24% | $736.26M | 11.65% |
| Boot Barn Holdings | Buy | 13.71% | $152.86M | 2.94% |
Key Takeaway:
Burlington Stores ranks at the top for Revenue Growth among its peers. It is in the middle for Gross Profit. For Return on Equity, it is at the bottom compared to its peers.
Discovering Burlington Stores: A Closer Look
Burlington Stores Inc is off-price retailer offering an extensive selection of in-season, fashion-focused merchandise including: women's ready-to-wear apparel, menswear, youth apparel, baby, beauty, footwear, accessories, home, toys, gifts and coats. Company sell a broad selection of desirable, first-quality, current-brand, labeled merchandise acquired directly from nationally recognized manufacturers and other suppliers. Company sell product in category such as Ladies apparel, Accessories and shoes, Home, Mens apparel, Kids apparel and baby and Outerwear.
Financial Insights: Burlington Stores
Market Capitalization: Exceeding industry standards, the company's market capitalization places it above industry average in size relative to peers. This emphasizes its significant scale and robust market position.
Revenue Growth: Burlington Stores displayed positive results in 3 months. As of 31 July, 2024, the company achieved a solid revenue growth rate of approximately 13.37%. This indicates a notable increase in the company's top-line earnings. As compared to competitors, the company surpassed expectations with a growth rate higher than the average among peers in the Consumer Discretionary sector.
Net Margin: Burlington Stores's net margin is below industry averages, indicating potential challenges in maintaining strong profitability. With a net margin of 2.99%, the company may face hurdles in effective cost management.
Return on Equity (ROE): Burlington Stores's financial strength is reflected in its exceptional ROE, which exceeds industry averages. With a remarkable ROE of 7.02%, the company showcases efficient use of equity capital and strong financial health.
Return on Assets (ROA): Burlington Stores's ROA lags behind industry averages, suggesting challenges in maximizing returns from its assets. With an ROA of 0.95%, the company may face hurdles in achieving optimal financial performance.
Debt Management: The company faces challenges in debt management with a debt-to-equity ratio higher than the industry average. With a ratio of 4.5, caution is advised due to increased financial risk.
To track all earnings releases for Burlington Stores visit their earnings calendar on our site.
This article was generated by Benzinga's automated content engine and reviewed by an editor.


