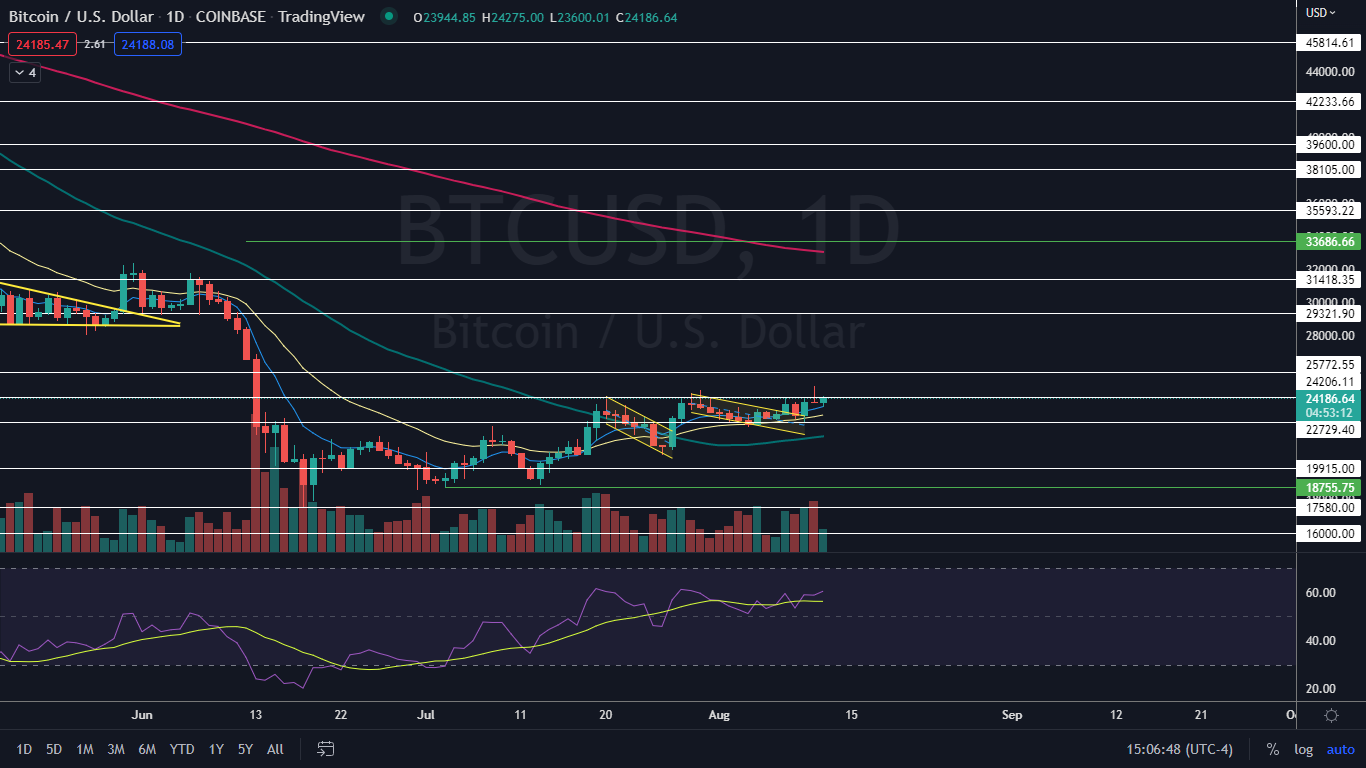
Bitcoin (CRYPTO: BTC) was trading mostly flat during Friday’s trading session. The crypto has been unusually quiet over the month of August, trading mostly sideways between about $22,700 and $24,300.
The long-term consolidation within the horizontal pattern has helped Bitcoin to cool its relative strength index (RSI), which reached about 61% on July 28, after the crypto shot up over 12% between that day and the day prior.
Despite the low volatility, Bitcoin is trading in a clear and consistent uptrend on the daily chart, as is Dogecoin (CRYPTO: DOGE) and Ethereum (CRYPTO: ETH), although Ethereum has been the strongest crypto of the three. So far this month, Bitcoin has gained just 3.65%, Dogecoin has risen about 4.8% while Ethereum has soared more than 14% higher since opening on Aug. 1.
The lack of movement in Bitcoin and Dogecoin is due to a lack of trading volume, which indicates a lack of interest even though the bulls are in control. Ethereum, on the other hand, has been gaining in popularity as the crypto approaches its planned merge date, which was bumped up to Sept. 15.
Ethereum Classic (CRYPTO: ETC) looks to be the crypto benefiting the most from the interest in Ethereum. The crypto surged over 20% between Wednesday and Friday.
If Bitcoin can catch bullish momentum over the weekend, Ethereum and other cryptos could follow suit.
Want direct analysis? Find me in the BZ Pro lounge! Click here for a free trial.
The Bitcoin Chart: Bitcoin’s most recent confirmed higher low within its uptrend was formed on Aug. 10 at $22,669 and the most recent higher high was printed at the $24,929 mark during Thursday’s 24-hour trading session. On Friday, Bitcoin fell lower to test support at the eight-day exponential moving average and bounced up from the level, perhaps printing the next higher low.
- The eight-day EMA has acted as solid support since July 27, slowly guiding the crypto higher. Traders interested in taking profits may choose to do so if Bitcoin closes a trading day below the eight-day EMA or forms a lower low on the daily chart, which would negate the uptrend.
- Bearish traders want to see big bearish volume come in and force Bitcoin to close below the eight-day EMA, which could give bearish traders the strength to drop the crypto down below the horizontal trendline at about $22,400. If Bitcoin were to fall below the 21-day EMA, the eight-day EMA would eventually cross below the eight-day EMA, which would give bearish traders more confidence going forward.
- Bitcoin has resistance above at $24,206 and $25,772 and support below at $22,729 and $19.915.

Photo: Tomasz Makowski via Shutterstock


