Alibaba Group Holdings, Ltd (NYSE:BABA) gapped up over 3% higher on Tuesday, where the stock ran into a group of sellers who pressured it down to almost completely fill that empty trading range.
The premarket boost was due to news Alibaba intends to apply for a primary listing in Hong Kong, but intraday the China-based tech giant was being pressured lower by the general markets, which saw the S&P 500 trading down about 0.7%.
Alibaba has failed to penetrate the U.S. market since launching its e-commerce marketplace in the country in 2019, according to a report. The Amazon.com, Inc (NASDAQ:AMZN) rival initially had a goal aimed at signing up over 1 million local businesses, but has drastically reduced that target to just 2,000 after the majority of its initial marketplace sellers cancelled their subscriptions in 2020.
In an inverse reaction to the news, Amazon gapped down 4.41% lower to start Tuesday’s trading session, but was rebounding slightly intraday.
Both e-commerce giants are expected to print their quarterly earnings in the near future, with Amazon printing its second-quarter results this Thursday after the market close and Alibaba set to print its first-quarter 2023 earnings on Aug. 4.
Together, the results will provide traders and investors with a good idea of how soaring inflation, rising interest rates and a looming recession have affected big e-commerce companies both in the U.S. and overseas.
Want direct analysis? Find me in the BZ Pro lounge! Click here for a free trial.
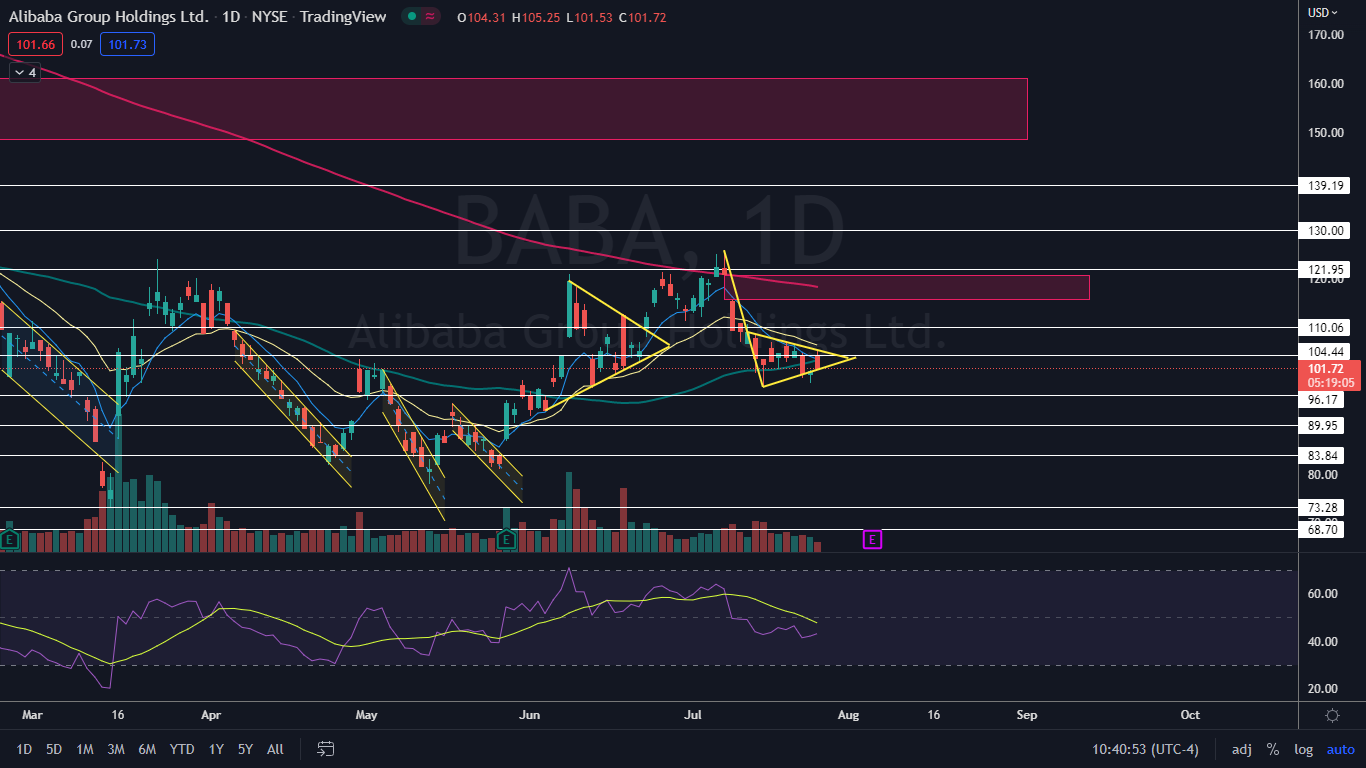
The Alibaba Chart: After running about 61% higher between May 12 and July 8, Alibaba entered into a downtrend between July 11 and July 15 and has since been trading sideways, possibly settling into a symmetrical triangle pattern on the daily chart. Alibaba is set to meet the apex of the triangle on Aug. 2 and traders and investors can watch for the stock to break up or down from the pattern on higher-than-average volume before that date to gauge whether the pattern was recognized.
- Although a symmetrical triangle pattern is often viewed as neutral, in Alibaba’s case, the downtrend prior to the triangle printing may have settled Alibaba into a bear flag pattern. If the pattern becomes recognized, the measured move is 22%, which suggests the stock could fall toward $83.
- There is a gap above on Alibaba’s chart between $115.58 and $120.70 that was left behind on July 11. Gaps on charts fill about 90% of the time, which makes it likely Alibaba will rise up to fill the empty trading range in the future, although it could be some time before that happens.
- Alibaba has resistance above at $104.44 and $110.06 and support below at $96.17 and $89.95.

See Also: iPhone Discount? Apple Rare Move Means Nearly $100 For China Buyers With An Alibaba Connect


