A modest monthly budget goes a long way in the Midwest. Key findings from a GOBankingRates in-house research study indicate there are 26 Illinois cities where retirees can comfortably live on $3,000 a month and enjoy a high quality of life.
For this study, GOBankingRates sourced several key data points including each city’s retirement population ages 65 and over, median household income and total cost of living (calculating average mortgage and expenditure costs. We kept all cities with a livability score of 75 or higher and sorted the places accordingly to show those areas with the highest livability locations first.
Check Out: GOBankingRates Original Research Center
Discover Next: 5 Clever Ways Retirees Are Earning Up To $1K per Month From Home
Keep reading to see which 26 Illinois cities seniors can retire in for $3,000 or less a month.
Do you have $500,000 in retirement savings? Consider retiring in one of these Illinois metros.

1. Jerome
- Population ages 65+ (%): 16.5%
- Median household income: $65,189
- Average home value: $149,006
- Total monthly cost of living: $2,695
- Livability: 92
Trending Now: 25 Cities Where You Can Retire in Great Weather for $2,000 a Month
Be Aware: Here’s What Retirees Wasted the Most Money On in 2025 — and How To Avoid It in 2026

2. Princeton
- Population ages 65+ (%): 25.7%
- Median household income: $61,946
- Average home value: $161,197
- Total monthly cost of living: $2,720
- Livability: 81
That’s Interesting: Major 401(k) Change Coming in 2026 — High Earners Must Act Now

3. Dixon
- Population ages 65+ (%): 19.9%
- Median household income: $59,406
- Average home value: $165,520
- Total monthly cost of living: $2,728
- Livability: 81

4. Springfield
- Population ages 65+ (%): 19.9%
- Median household income: $66,064
- Average home value: $160,213
- Total monthly cost of living: $2,740
- Livability: 81

5. Urbana
- Population ages 65+ (%): 11.5%
- Median household income: $45,346
- Average home value: $201,222
- Total monthly cost of living: $2,956
- Livability: 81

6. Morrison
- Population ages 65+ (%): 21.7%
- Median household income: $69,089
- Average home value: $158,666
- Total monthly cost of living: $2,785
- Livability: 80
7. Belleville
- Population ages 65+ (%): 16.4%
- Median household income: $63,535
- Average home value: $153,419
- Total monthly cost of living: $2,687
- Livability: 79
Read Next: How Much You Need To Save Monthly To Retire Comfortably in Every State

8. Roanoke
- Population ages 65+ (%): 21.7%
- Median household income: $82,063
- Average home value: $163,001
- Total monthly cost of living: $2,813
- Livability: 78

9. Jacksonville
- Population ages 65+ (%): 18.7%
- Median household income: $65,432
- Average home value: $131,409
- Total monthly cost of living: $2,564
- Livability: 77

10. Bethalto
- Population ages 65+ (%): 22.9%
- Median household income: $64,775
- Average home value: $190,766
- Total monthly cost of living: $2,868
- Livability: 77

11. Oglesby
- Population ages 65+ (%): 18.7%
- Median household income: $76,189
- Average home value: $161,903
- Total monthly cost of living: $2,734
- Livability: 76
12. Tuscola
- Population ages 65+ (%): 16.2%
- Median household income: $78,179
- Average home value: $171,887
- Total monthly cost of living: $2,758
- Livability: 76
Explore More: This ‘Boring’ Investment Could Be the Secret To Never Running Out of Retirement Income

13. Park Forest
- Population ages 65+ (%): 15.8%
- Median household income: $61,072
- Average home value: $150,392
- Total monthly cost of living: $2,769
- Livability: 76

14. Nashville
- Population ages 65+ (%): 22.4%
- Median household income: $63,170
- Average home value: $168,758
- Total monthly cost of living: $2,776
- Livability: 76

15. Fairbury
- Population ages 65+ (%): 20.3%
- Median household income: $70,962
- Average home value: $182,972
- Total monthly cost of living: $2,836
- Livability: 76

16. Fairview Heights
- Population ages 65+ (%): 19.3%
- Median household income: $80,930
- Average home value: $187,680
- Total monthly cost of living: $2,864
- Livability: 76

17. Ottawa
- Population ages 65+ (%): 16.4%
- Median household income: $71,413
- Average home value: $200,382
- Total monthly cost of living: $2,956
- Livability: 76
Consider This: Trump Promised Tax Relief for Seniors — Here’s What Retirees Are Seeing Now
18. Harrisburg
- Population ages 65+ (%): 20.6%
- Median household income: $43,415
- Average home value: $87,258
- Total monthly cost of living: $2,372
- Livability: 75

19. West Peoria
- Population ages 65+ (%): 23.3%
- Median household income: $66,098
- Average home value: $108,101
- Total monthly cost of living: $2,459
- Livability: 75

20. Dupo
- Population ages 65+ (%): 14.8%
- Median household income: $61,644
- Average home value: $122,040
- Total monthly cost of living: $2,487
- Livability: 75

21. Moline
- Population ages 65+ (%): 18.7%
- Median household income: $67,701
- Average home value: $143,577
- Total monthly cost of living: $2,525
- Livability: 75

22. Pekin
- Population ages 65+ (%): 19.4%
- Median household income: $60,790
- Average home value: $134,055
- Total monthly cost of living: $2,617
- Livability: 75
Be Aware: 8 Things To Stop Doing After 60, According To Kevin Lum

23. Fulton
- Population ages 65+ (%): 22.3%
- Median household income: $45,581
- Average home value: $152,294
- Total monthly cost of living: $2,705
- Livability: 75

24. East Peoria
- Population ages 65+ (%): 20.7%
- Median household income: $71,833
- Average home value: $170,820
- Total monthly cost of living: $2,820
- Livability: 75
25. Thornton
- Population ages 65+ (%): 19.2%
- Median household income: $59,647
- Average home value: $170,803
- Total monthly cost of living: $2,836
- Livability: 75

26. Machesney Park
- Population ages 65+ (%): 17.4%
- Median household income: $75,489
- Average home value: $195,531
- Total monthly cost of living: $2,919
- Livability: 75
Discover more original studies and surveys in the GOBankingRates original research center.
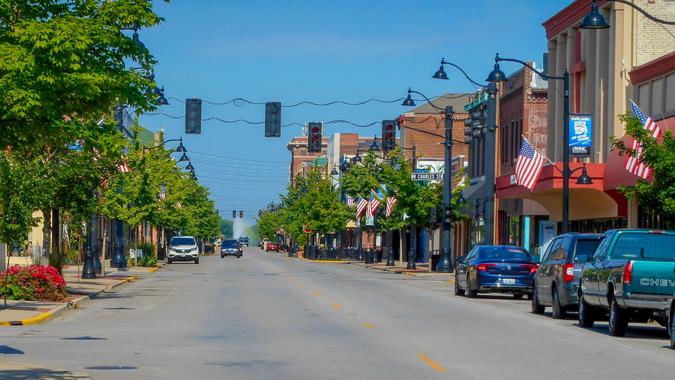
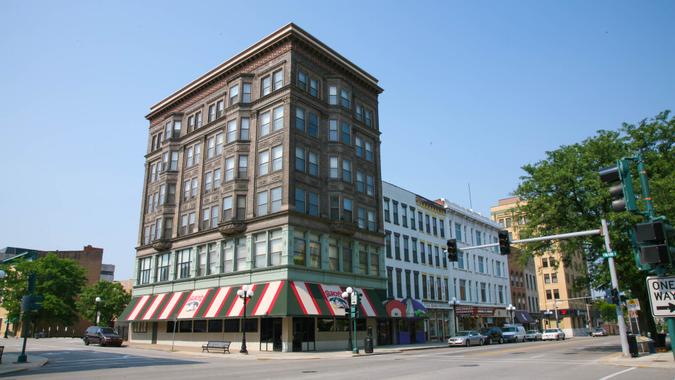
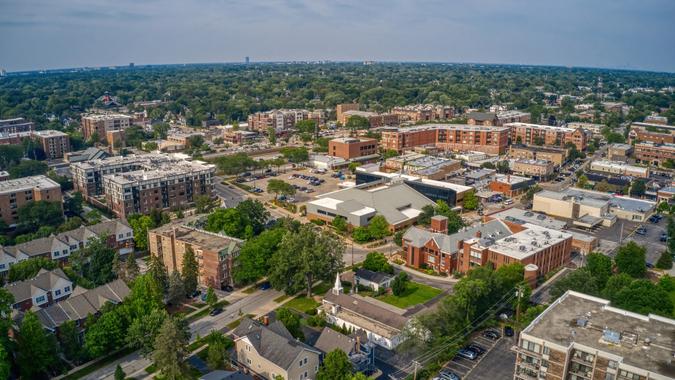
Photo disclaimer: Photos are for illustrative purposes only. In many cases, the closest major city outside of the city/county mentioned in the article was used.
Methodology: For this study, GOBankingRates analyzed cities in Illinois to find the best cities to retire on $3,000 a month. Using the 2024 5-Year U.S. Census ACS various data was sourced including total population, population ages 65 and over, total households, and median household income. Cost of living indexes were sourced from Sperling’s BestPlaces and using the national average expenditure costs for retired households, as sourced from the Bureau of Labor Statistics Consumer Expenditure Survey for retired consumer units, the average expenditure costs for each city can be calculated. The average single family home value was sourced from Zillow Home Value Index for December 2025. Assuming a 10% down payment and using the national average 30-year fixed mortgage rate, as sourced from the Federal Reserve Economic Data, the average mortgage can be calculated. Using the average mortgage and expenditure costs, the total cost of living can be calculated for each city. Places with a total monthly cost of living over $3,000 were removed for this study. The livability index was sourced from AreaVibes and the places were sorted to show the highest livability locations first, representing the places with the highest quality of life. All data is up to date as of Feb. 4, 2026.
More From GOBankingRates
This article originally appeared on GOBankingRates.com: 26 Best Illinois Cities To Retire on $3,000 a Month